Usage tab
Overview
The Licensing & Usage tab provides graphic-based analytics on Boomi Platform usage. Key features include:
- Comprehensive usage metrics: a detailed breakdown of usage with real-time data and insights. Track consumption patterns, monitor usage against each of your plans, and predict future needs to understand potential cost implications.
- Multi-plan visibility: if your account has more than one active plan, the Usage tab shows a summary card for each plan, so you can compare consumption across plans without switching accounts.
- Enhanced visuals and navigation: a modern interactive dashboard interface featuring intuitive graphs and summarized data for quick viewing, with the option to drill down into a specific plan for detailed information.
To access the Usage tab, sign in to the Boomi Platform and select your account name in the top right corner to open the Settings menu. Select Usage under Account in the left-hand menu.
Multi-plan summary dashboard
If your account has multiple active plans, the Usage tab opens to a summary dashboard with one card per plan, grouped under Account Plan and Product Plan headers. Each card shows:
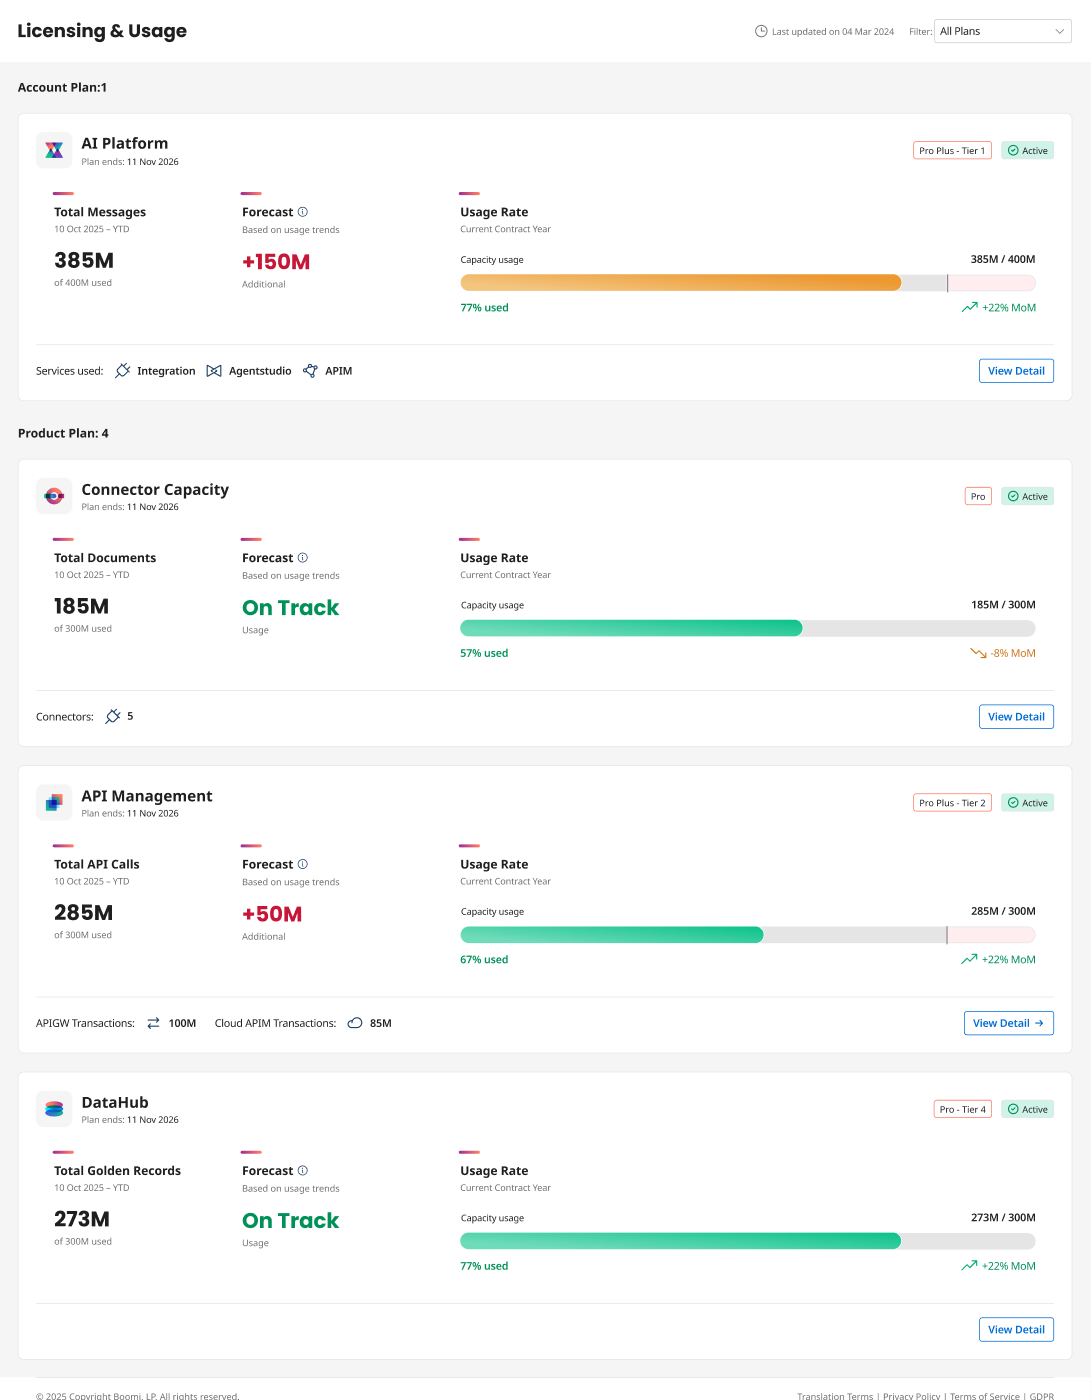
- Plan name, edition, and tier (when applicable)
- The plan's annual period start and end dates
- Capacity used versus total capacity, shown with a usage progress bar
- Forecast status, when your projected usage is on track to exceed the plan's capacity
- A View Detail button that opens the plan's detail view
Cards are color-coded by status:
- Green: usage is on track
- Amber: usage is at risk of exceeding capacity
- Red: usage is over capacity
Cards are sorted with over-capacity plans first, at-risk plans second, and on-track plans last, so the plans that need your attention appear at the top of the dashboard.
New plan types added to your contract appear automatically on the dashboard using a standard card layout, even before a custom card design exists for that plan type.
Viewing plan details
Select View Detail on any plan card to open that plan's detail view. The information shown depends on the plan type.
Product plan detail view
Standalone product plans, such as Boomi Flow, Boomi MFT, Boomi Connect, and Boomi API Management, use the product plan detail view. This view includes:
- A monthly usage trend chart showing a single usage series for the plan
- A usage summary panel with total used, remaining capacity, and forecast
- A toggle to compare current usage against the previous year
Account plan detail view
Multi-product account plans, such as AI Platform, One Platform, and Full Consumption, use the account plan detail view. This view includes:
- A stacked monthly bar chart, with each Boomi product in the plan shown as a separate series
- Usage widgets for each product in the plan, shown below the chart
- Badges showing the plan's edition and tier
Integration plan detail
For Integration plans, the detail view also includes a connector breakdown panel:
- Connector usage broken down by class: Small Business, Standard, Enterprise, and Trading Partner
- Purchased versus deployed connector counts for each class
- A connector deployment table listing runtime name, whether the connector is used in a process, connector name, and whether the connector is inherited
This panel only appears when connector data is available for your account.
