Detecting anomalies
Agent Control Tower introduces anomaly detection, transforming the Agent Control Tower from a passive monitoring dashboard into an intelligent observability dashboard that enables you to rapidly identify issues. Anomaly detection empowers you with insight into irregular or unexpected agent behaviors.
Anomaly detection covers agents from Boomi Agent Garden, Amazon Bedrock, and Custom providers. Each anomaly is shown with its provider-specific agent name and logo, so you can tell at a glance which provider an anomalous agent belongs to.
Benefits of anomaly detection
- Proactive Monitoring: Automatically flags unusual behavior in agent performance, helping you take corrective action before it impacts your business processes.
- Data-Driven Insights: Uses statistical modeling based on the last 30 days of activity to define dynamic normal ranges for each agent.
- Improved Visibility: Centralized Anomaly Page displays anomalies across all agent aliases, with filters for provider, runtime, anomaly type, and time period. Each runtime instance is evaluated independently, so anomalies in one deployment do not affect the baseline of another.
- Faster Troubleshooting: Enables you to quickly identify which agents, accounts, or metrics are behaving abnormally.
- Operational Efficiency: Reduces manual monitoring effort and provides early signals for performance optimization or scaling decisions.
The Control Tower performs anomaly detection at the account level, not at the user level. The system activates anomaly detection when you log into your Control Tower account. Currently, the system does not provide active alerts when the Agent Control Tower is inactive.
Error vs anomaly
-
Error: It usually means something went wrong according to predefined rules, for example, all forms of Throttles, Server Errors, and Client Errors.
-
Anomaly: An Anomaly reports unusual, unexpected, or irregular behaviour that may not necessarily be wrong but is outside normal patterns. The detection uses a 30-day metric window to establish a baseline behaviour and scope out deviations.
How is an anomaly calculated?
The anomalies are calculated only when you log into the Agent Control Tower. Anomalies are calculated by tracking trends over a 30-day period. Any deviation from the recognised trend is flagged as an anomaly. Agent Studio continues to collect the agent metrics as soon as you interact with an agent. Every 5 minutes Agent Control Tower checks for anomalies, and any anomalies found are notified irrespective of the page you are working on but these notification banners are only visible if you are in Agent Control Tower.
Anomaly detection applies across Boomi Agent Garden, Amazon Bedrock, and Custom provider agents, using each provider's incoming metric data for accurate calculations.
Anomalies are aggregated and displayed in time buckets of an hour. This aims to give you a deeper understanding as to when the agent behaved unusually.
The baseline of an anomaly is the average (AVG) and standard deviation (STDDEV) for a specific metric computed over the past 30 days for a fixed agent alias. Each runtime instance is evaluated independently. An alias is identified as: Agent Name + Package Version + Runtime Name.
A metric is marked as anomalous when its value differs from the 30-day average by more than a set multiplier (currently using a default value) times the 30-day standard deviation. The system checks the lowest and highest values in each 1-hour period. For example, if the average number of invocations over the last 30 days was 1,000, and a new period suddenly records 20,000, this sharp increase would likely be flagged as an anomaly because 20,000 is much higher than what the system’s 30-day baseline expects.
For new agents, anomalies are detected using whatever limited data is available. If a new agent’s metrics go beyond the allowed threshold range, they’ll be flagged as anomalies. However, small variations are expected and will still be considered normal, only large deviations from typical behavior are treated as anomalies.
Accessing anomalies
You can navigate to the Anomaly page from the left-hand menu or by using the anomaly icon present on every screen. When you log into Agent Control Tower, the system displays a notification for new anomalies.
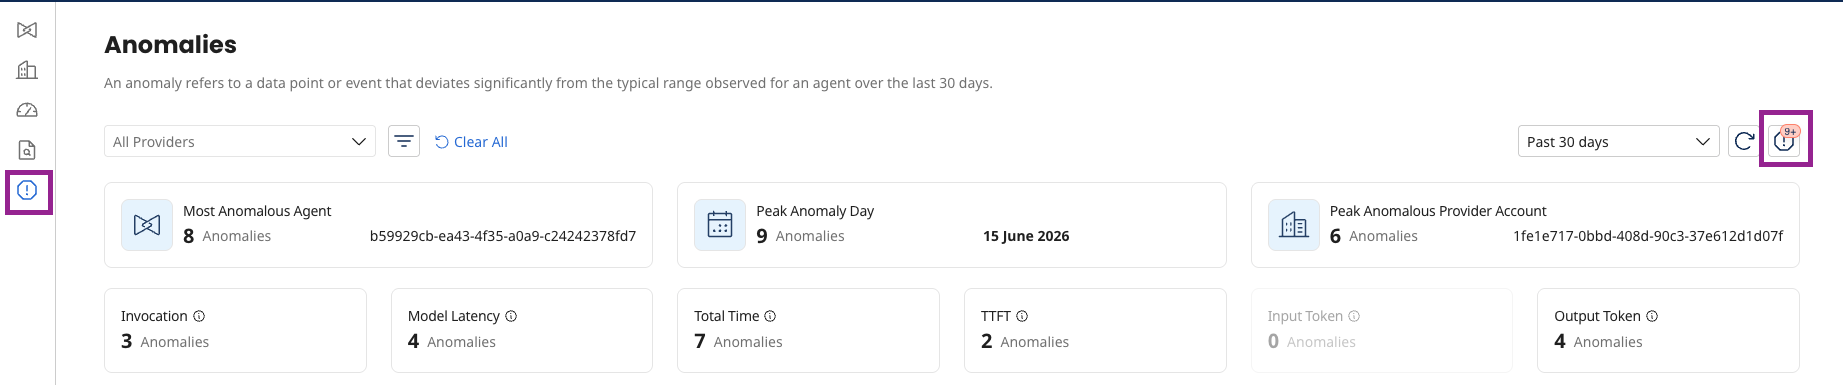
For every detected anomaly, the system collects and presents the following data on the dashboard.:
- Most Anomalous Agent: The agent with the highest number of anomalies detected within the selected time range and filters.
- Peak Anomaly Day: The single day within the selected time range and filters where the highest number of anomalies occurred.
- Peak Anomalous Account: The account with the highest number of anomalies detected within the selected time range and filters.
Below the summary cards, a card for each anomaly type shows how many anomalies of that type were detected: Invocation, Model Latency, Total Time, TTFT, Input Token, and Output Token.
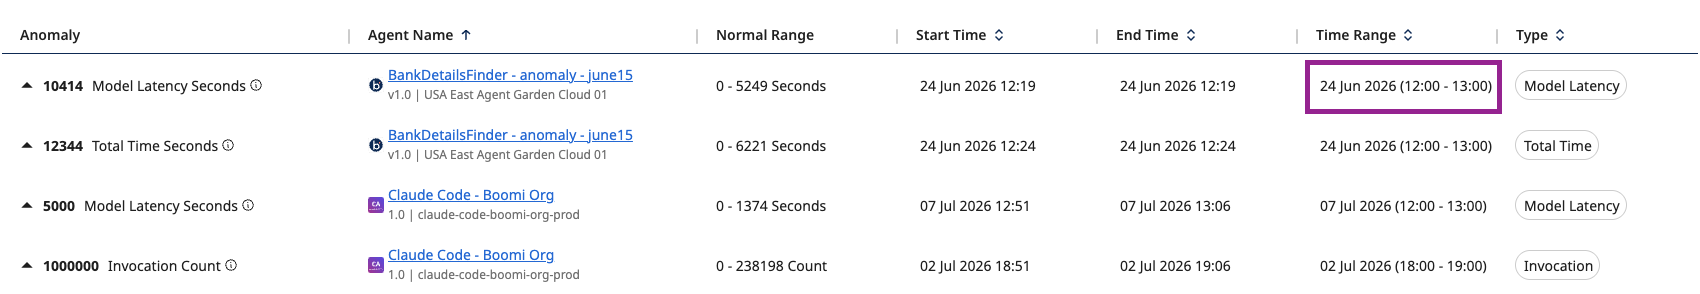
Anomaly listing
The anomaly table lists each detected anomaly with the following columns:
| Column | Description |
|---|---|
| Anomaly | The anomalous metric value and metric name (for example, 5000 Model Latency Seconds). |
| Agent Name | The provider-specific agent name, version, and runtime/alias, shown with the provider logo. |
| Normal Range | The expected range for that metric, based on the 30-day baseline. |
| Start Time | When the anomalous period started. |
| End Time | When the anomalous period ended. |
| Time Range | The 1-hour bucket the anomaly falls in. |
| Type | The anomaly type (for example, Model Latency, Invocation, Output Token, Total Time). |
Filtering anomalies
Filtering lets you view anomalies according to specific requirements. You can filter by:
- Agents
- Providers
- Anomaly Type
These filters align with the filters on the Monitoring and Compliance page. The filter applies to all the summary cards and the table contents. To reset every selection at once, click Clear All.
The default time range is Past 7 days. This view filter is separate from the 30-day baseline window used to calculate normal ranges, which is unchanged.
The anomaly types include:
| Anomaly/Metric name | Unit | Description |
|---|---|---|
| Invocation | Count | Invocation Count refers to the total number of times an AI agent was invoked. |
| Model Latency | Seconds | Model Latency refers to the amount of time taken by the AI agent’s model itself to process and generate a response, excluding network and preprocessing delays. |
| Total Time | Seconds | Total Time refers to the overall time taken for an AI agent execution, from the start of the request to completion. |
| TTFT(Time to First Token) | Seconds | TTFT(Time to First Token) refers to the time taken from sending a user query to receiving the first token of the AI agent’s response. |
| Input Token | Tokens | Input Token refers to the total number of tokens in the text sent to an AI agent as part of a user query. |
| Output Token | Tokens | Output Token refers to the total number of tokens generated in an AI agent’s response to a user query. |
