Tracing sessions of Boomi Agent Garden agents
Agent session logs provide comprehensive visibility into agent behavior, performance, and troubleshooting details. They help you understand how an agent reasons, diagnose issues quickly, and optimize agent effectiveness. Refer to Testing and troubleshooting your agent to learn more.
Session logs are only available for deployed Boomi Agent Garden agents. They are available for deployed conversational agents. They allow you to:
-
View an agent’s reasoning while running in production mode.
-
Track and review all sessions executed by the agent.
Session logs are only applicable for Boomi agents used within Agent Garden. You cannot access session logs for Boomi agents used in integration processes as an agent step. For more information, refer to Limitations in session logs.
Key benefits of session logs
-
Transparency into agent decision-making: Using the chain of thought reasoning, session logs provide real-time visibility into the agent’s thought process and allow you to understand its step-by-step logic. This feature allows you to understand why an agent produced a specific recommendation or result.
-
Streamlined debugging and faster resolution: You can access comprehensive logs that include tool inputs and outputs, LLM reasoning, and full invocation traces. Detailed error logs and invocation-level debugging enable you to quickly identify root causes at the tool level, significantly speeding up the troubleshooting process. Session logs provide clear, understandable explanations of what went wrong and which specific step in the process failed.
-
Comprehensive performance monitoring: The logs provide essential performance data, including Time to First Token (TTFT), average latency, and success/failure rates per session or invocation. You can track token consumption (input and output) and the number of LLM invocations, which is critical for managing costs in high-volume workflows. This comprehensive monitoring is done at the agent, session, and invocation levels.
-
Governance and compliance: You can monitor when and why specific a guardrail is triggered, identifying policy violations or content types that were blocked or warned.
Limitations
Session logs currently have the following limitations:
-
Agent Step Logs: Session logs are not available for agents invoked via the integration step.
-
Draft and Structured agents:
- Session logs are not available for test panel invoked agents or Garden Structured agents.
- Only deployed conversational agents produce session logs.
Navigating to session logs
You can access session logs from either Agent Garden or Agent Control Tower.
Through Agent Garden
While conversing with an agent
When chatting with an agent in production:
-
Under the agent’s response, click the View log icon.
-
You are redirected to the current session log in Agent Control Tower.
From the agents page
-
Navigate to the required agent.
-
Click the Actions menu.
-
Select View log to open the agent’s session log page.
Through Agent Control Tower
From the agents page
-
Select the required agent.
-
Click View Details.
-
Navigate to the Logs tab.
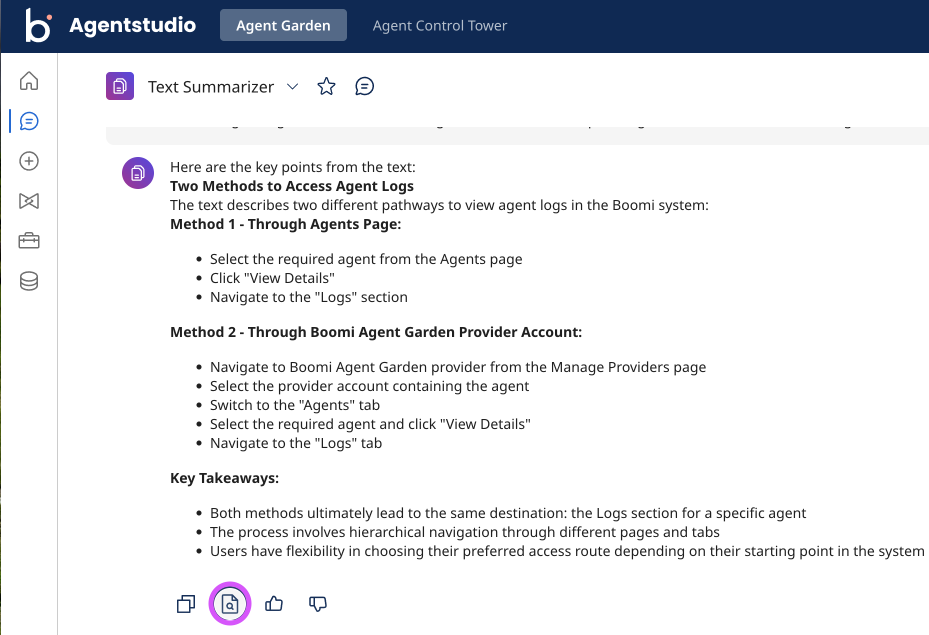
From the Boomi Agent Garden provider account
-
Navigate to Manage Providers and select the Boomi Agent Garden provider.
-
Select the provider account containing the agent.
-
Open the Agents tab.
-
Select the required agent and click View Details.
-
Navigate to the Logs tab.
From the Invocation List page
The Invocation List page surfaces agent information alongside each session log entry, giving you context on which agent and runtime generated the invocation without navigating away.
-
Navigate to Agent Control Tower.
-
Open the Invocation List page.
-
Locate the session log entry. The associated agent name, version, and runtime are displayed inline.
-
Click the entry to open the full session details.
Filtering out session logs
Session logs are associated with a combined deployment ID and runtime ID. Once filtered, clicking a session log entry takes you to the session details for that cloud runtime.
You can filter session logs using the time filter. The filter includes the following time periods:
- Last 30 minutes
- Last 60 minutes
- Last 3 hours
- Last 6 hours
- Last 12 hours
- Last 24 hours
- Last 7 days
- Last 30 days
- Last 3 months
- Last 6 months
- Custom
Using the Custom option you can filter out session logs up to a period of one year.
Understanding session logs
The session logs help you understand the agent's performance on three different levels:
-
The overview performance of the agent(Account level): You can see agent performance on account level, i.e., aggregate of agent metrics by all users of the account.
-
The in-depth session metrics of the agent(User-specific): Session metrics are user-specific, showcasing their interactions with the agent.
-
An in-depth view per invocation the agent has made(User-specific): Invocation metrics are user-specific, showcasing their interactions with the agent.
Overview level
Based on the selected time range, the overview page displays aggregated agent metrics and allows navigation to individual sessions.
| Agent metric | Description |
|---|---|
| Total Sessions | Total number of agent interaction sessions initiated with the agent. |
| Error Rate | Percentage of invocations where the agent encountered execution errors or failed to complete successfully. |
| Guardrails Triggered | Count of times safety, policy, or validation guardrails were activated during agent execution. |
| Tool Calls | Tracks frequency of automated tool executions triggered by the agent to fulfill user requests beyond simple text generation. |
| Average Latency | Average time taken by the agent to process and respond per interaction. |
| Total Tokens | Total number of tokens consumed by the agent for both input and output during execution. |
Under the Sessions section, you can see details in regard to:
| Metric | Description |
|---|---|
| Session Name/ID | Brief name describing what the invocation was about, along with the Session ID present under the name. |
| Last Invocation | Date and time of when the invocation occurred. |
| Invocation | The number of times the invocation was carried out. |
| Guardrails Triggered | If any guardrails are triggered. Options are Yes or No. |
| Tool Calls | Tracks the frequency of automated tool executions triggered by the agent to fulfill user requests beyond simple text generation. |
| Error Rate | Indicates if an error occurred in terms of percentage. This percentage us calculated, based on the total number of invocations and the number of successful invocations. For example, supposing for every 100 invocations in one session, 87 invocations fail, then error rate is 87% and success rate is 13%. |
Session level
Clicking a Session Name/ID opens the session page.
The Invocation Success Rate graph provides a visual breakdown of successful and failed invocations.
The following Session Metrics are recorded:
| Metric | Description |
|---|---|
| Invocation | Invocation is the number of user prompts/conversations started with the agent within a single session. |
| Average Latency | The average time taken by an agent in a session to respond to user prompt. |
| Guardrail Hit | This is a Yes/No indicator that tells if a guardrail was hit for a particular invocation. Guardrail hit is a terminal event, it tells you that the invocation was a failure. |
| Total Tokens | Total token consumed by the agent, this includes input tokens and output tokens. |
| Tool Calls | Tracks the frequency of automated tool executions triggered by the agent to fulfill user requests beyond simple text generation. |
| Knowledge Base Queries | Number of Knowledge Base (Knowledge Hub retrieval) queries the agent made during the session. |
| Meta Hub Glossary Calls | Number of Meta Hub Glossary (semantic memory) calls the agent made during the session. |
| Session Duration | The total elapsed time from your initial prompt until the final response or session timeout, reflecting the complete lifecycle of the interaction. |
The Invocations table provides the following details:
| Metric | Description |
|---|---|
| Time | Date, time, and time zone of when the invocation occurred. |
| User Input | The prompt that was provided by you. |
| Agent Response | The agent's response to the prompt. |
| Status | If the invocation was a success or a failure. |
| Guardrails | If any guardrails were triggered. |
Invocation level
Clicking an invocation opens a detailed view with the following information:
A summary section covers:
| Metric | Description |
|---|---|
| Agent | Name of the agent. |
| Trace ID | ID assigned to that particular invocation. |
| Guardrails Hit | This is a Yes/No indicator that tells if a guardrail was hit for a particular invocation. Guardrail hit is a terminal event, it tells you that the invocation was a failure. |
| Error | The number of errors faced in that particular invocation. |
| Total Steps | Number of steps the chain of thoughts took to respond back to the prompt. |
| Tool Calls | Tracks the frequency of automated tool executions triggered by the agent to fulfill user requests beyond simple text generation. |
| LLM Performance metrics | Performance metrics of the Large language model, which include:
|
You also get to view the User Prompt along with the Agent Response for that particular invocation.
For an in-depth view of how the agent produced its response, the Chain of Thoughts walks you through the agent's reasoning:
- the LLM thinking steps
- the tools it called and their parameters — its Knowledge Base and Meta Hub Glossary retrieval steps. Each step shows its latency and input and output token counts. Knowledge Base and Glossary retrieval steps display their result counts and surface any errors, so you can see when and how the agent drew on retrieved knowledge or semantic memory.
