Monitoring your agents
Agent Control Tower displays Boomi Agent Garden agents as a single entry per agent Alias, where an agent Alias is a unique deployment and runtime combination. Both draft agents and deployed aliases appear together in the listing. For more information, refer to Viewing and managing your agents.
Agent naming convention
Each agent entry in ACT uses the following format: Agent Name
Version | Runtime/Alias
Where:
- Version is the package version from Agent Garden (for example, v1 or vDraft)
- Runtime is the runtime environment where that packaged version is deployed
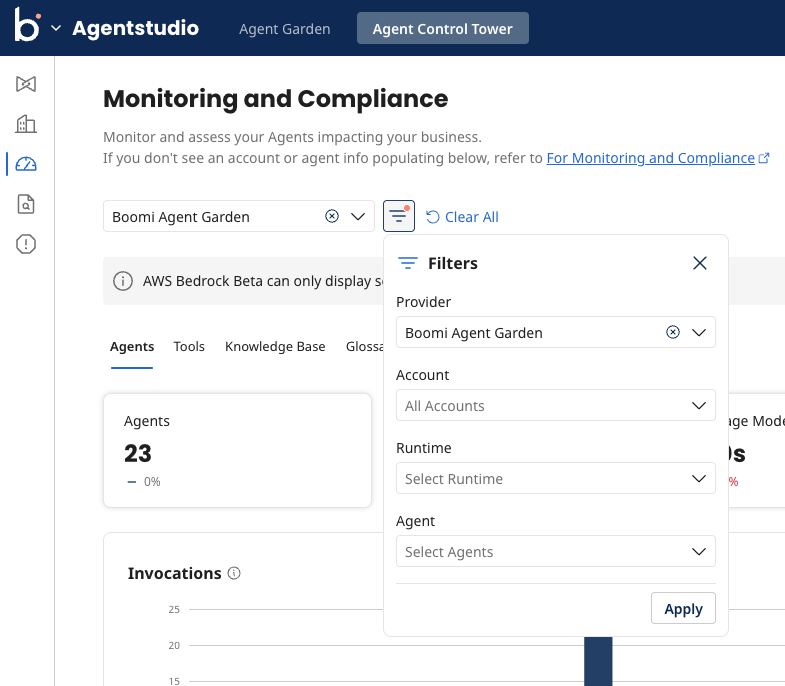
Filters
You can filter the metrics you want to monitor based on Providers. By default All Providers is selected. The filter The filter works on a top - down conditional basis; updating one filter option affects the others. For in-depth provider filtering, select the Provider you want to filter.
For example, if you choose the “Boomi Agent Garden” provider, in addition to the Provider field you get to filter by Account, Runtime, Agent, and Model.
Once you configure the filter according to your needs, click Apply. The filters you apply here also drive the data shown on the Tools, Knowledge Base, and Glossaries tabs.
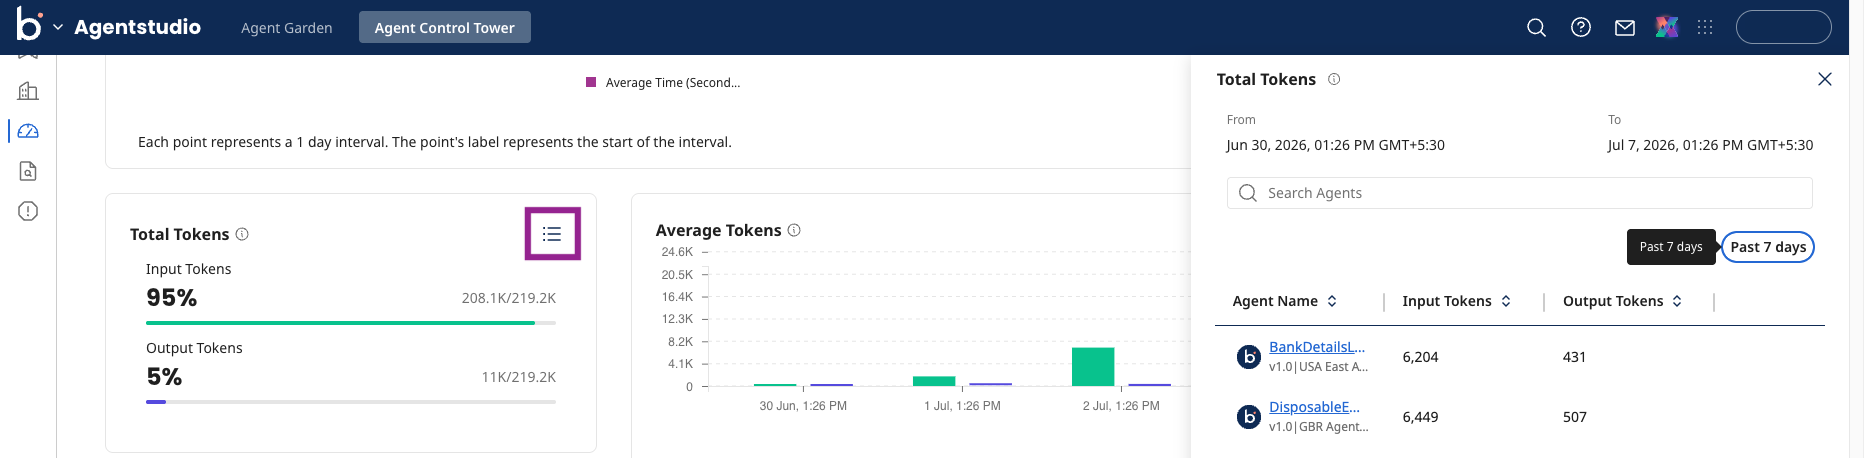
You can access detailed agent information on Invocations, Trust Level, Errors, and Tokens using the side drawer views by clicking the list icon. You can toggle between Agent and Model invocations.
The metrics for the AWS Bedrock agents and can currently display only certain items.
Microsoft Copilot and Salesforce agents are currently not available for monitoring.
Monitoring tabs
The Monitoring and Compliance screen organizes metrics and logs into tabs so you can focus on one dimension of agent activity at a time. All tabs respond to the same Monitoring Toolbar filters and time range you set at the top of the screen.
| Tab | What it shows |
|---|---|
| Agents | Agent- and model-level metrics: invocations, trust level, errors, and tokens. Refer to Observable metrics. |
| Tools | Tool call logs for Boomi and Custom providers. Refer to Tool usage metrics. |
| Knowledge Base | Knowledge Base (Knowledge Hub retrieval) query logs and metrics. Refer to Knowledge Base metrics. |
| Glossaries | Metahub Glossary (semantic memory) call logs and metrics. Refer to Glossary metrics. |
When no data matches your current selection, the Tools, Knowledge Base, and Glossaries tabs display No records available for the current filters.
Prerequisites
To view the metrics for your Amazon Bedrock agents, ensure you have enabled Bedrock Agent metric data access.
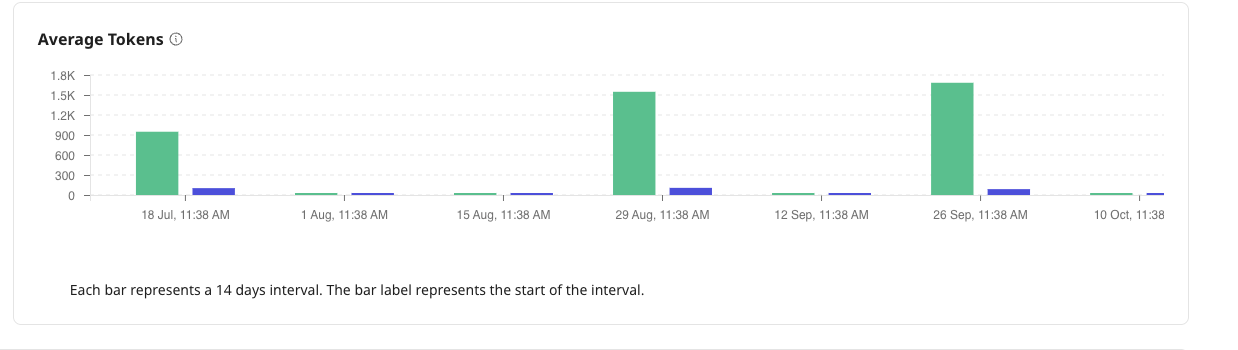
Understanding metric time charts
The charts on the Monitoring and Compliance page display data in time intervals based on the selected time range filter.
- Each bar or point represents a time interval (for example, a 14-day interval when the filter is set to Last 3 months).
- The label on the X-axis represents the start of the interval.
- Time zone information is not shown on the X-axis to keep the charts clear and easy to read. The selected time zone is shown in the filter section at the top right and reflects the your local time zone.
Agent metrics
The following metrics are tracked in the Agent Control Tower:
| Metric name | Description | Amazon Bedrock | Boomi Agent Garden |
|---|---|---|---|
| Total Tokens | Input and Output Usage Metrics. | Present | Present |
| Total Agent Invocations | Counts the total number of times an agent was invoked (for example, when a user sends a request to the agent). | Present | Present |
| Total Model Invocations | Counts the total number of times the underlying AI model was invoked while processing agent requests. One agent invocation may trigger multiple model invocations. | Present | Present |
| Agents | Total number of agents based on the time frame selected. | Present | Present |
| Invocations | Counts the number of times an agent is triggered or called to perform a task or function. It's the process of activating the agent and initiating its execution within a larger workflow or system. | Present | Present |
| Invocation Throttles | A mechanism to limit the frequency or number of times a specific function or action is called within a certain period. This is often implemented to prevent overloading systems, particularly when dealing with APIs or external resources, and to ensure fair and stable usage. | Present | Not present |
| Average Time per Invocation | Measures the average time taken for a process or operation, indicating overall performance. | Present | Present |
| Trust Level | States if the agent is Endorsed, Unendorsed, or Deprecated. Recovered from the metadata filled in on Agent Control Tower. | Present | Present |
| Input Token Count | Measures the number of input tokens processed, indicating how much data is being used. | Present | Present |
| Output Token Count | Measures the number of output tokens generated, reflecting the volume of data produced by the model. | Present | Present |
| Average Tokens | Average Input and Output tokens used. | Present | Present |
| Errors | Accounts for the Invocation Server Errors and Invocation Client Errors. | Present | Present |
| Invocation Server Errors | Counts server-side errors during invocation, indicating Runtime issues. | Present | Present |
| Model Invocation Server Errors | Similar to Invocation Server Errors but specific to model invocations. | Present | Present |
| Invocation Client Errors | Counts client-side errors during invocation, reflecting issues at the request level. | Present | Present |
| Model Invocation Client Errors | Similar to InvocationClientErrors but specific to model invocations. | Present | Present |
AWS Bedrock model invocation metrics
If Total Model Invocations shows zero or doesn't match your expected usage:
- Enable Model Invocation Logging in your AWS account. AWS disables this by default, so Control Tower receives no data until you turn it on.
- Check your CloudWatch console for the accurate usage data.
- Expect minor mismatches between agent and model invocation counts. AWS groups metrics in 1-minute windows, so invocations near the boundary of a window may appear in different time buckets.
Tool usage metrics for Boomi Garden agents
The Tools tab logs tool calls made by your agents across Boomi and Custom providers. Use it to see which tools your agents rely on and how reliably those calls complete.
| Metric name | Description |
|---|---|
| Tool Type | Defines the type of tool the agent uses, for example, MCP or Prompt Tool. |
| Total Calls | Indicates how many times AI agents called the tool. |
| Success Rate | The percentage of tool calls that completed successfully out of the total number of tool calls made. |
| Failures | Failure Count means how many tool calls are failed. |
Knowledge Base metrics
The Knowledge Base tab logs Knowledge Hub retrieval activity for your agents. The logs stay in sync with the filters and time range you apply in the Monitoring Toolbar.
Summary cards at the top of the tab show:
- Total Queries — total number of Knowledge Base queries in the selected period.
- Success Rate — percentage of queries that completed successfully.
- Average Latency — average time taken to return results.
The table below the cards breaks the activity down per Knowledge Base:
| Column | Description |
|---|---|
| Knowledge Base | The name of the queried Knowledge Base. |
| Queries | Number of queries made to that Knowledge Base. |
| Success Rate | Percentage of queries that completed successfully. |
| Failure | Number of queries that failed. |
| Avg Latency | Average time taken to return results for that Knowledge Base. |
| Chunks Returned | Number of content chunks returned across the queries. |
What are chunks and how are they calculated?
Each Knowledge Base query follows the same four steps:
- The agent asks: It sends a query to Knowledge Hub and specifies the maximum number of passages it wants.
- Knowledge Hub answers: It searches the Knowledge Base, applies any filters, and returns the best-matching passages, called chunks. It may return fewer than requested, or none.
- The runtime packs the budget: The model reserves a fixed token budget for Knowledge Base content (50,000 tokens by default). The runtime adds the highest-scoring chunks first until the budget is full.
- The model reads: Only the chunks that fit within the budget inform the response the model generates.
Chunk metrics
Chunk metrics show how retrieved content moves from Knowledge Hub into the model's context:
| Metric | Description |
|---|---|
| Chunks Returned | The number of chunks Knowledge Hub returned. This is independent of success: a query that returns zero chunks still succeeds because the query ran—it simply matched nothing. For example, the same query and result limit can return several chunks with a filter of file_type: "json" but none with file_type: "pdf" against the same content. |
| Chunks Used | The number of returned chunks fit into the model's context and informed the response. A chunk that is returned but not used is never seen by the model. |
| Chunks Dropped | The number chunks that were discarded either because a fully used token or the remaining space being too small to be useful. Low-confidence chunks may also be dropped to keep irrelevant content out of the agent's context. |
| Chunks Truncated | The number of used chunks shortened to fit the remaining budget. The model sees only the retained portion of a truncated chunk. |
Glossary metrics
The Glossaries tab logs Meta Hub Glossary (semantic memory) calls made by your agents. Like the other tabs, it stays in sync with the filters and time range you apply in the Monitoring Toolbar.
Summary cards at the top of the tab show:
- Total Calls — total number of Glossary calls in the selected period.
- Success Rate — percentage of calls that completed successfully.
- Failures — number of calls that failed. The table below the cards breaks the activity down per glossary:
| Column | Description |
|---|---|
| Glossary | The name of the called Meta Hub Glossary. |
| Total Calls | Number of calls made to that glossary. |
| Success Rate | Percentage of calls that completed successfully. |
| Failure | Number of calls that failed. |
