Viewing inbound activity reports
Viewing reports on processed batches of incoming source entities is a routine primary data governance task.
Before you begin
Masked values are visible if you have one of the following user permissions:, including originally submitted XML data:
- MDM - Privileged Data Steward role
- MDM - Administrator role
- MDM - Reveal Masked Data privilege
- MDM - Data Steward role (or MDM - Stewardship privilege) and the Reveal Masked Data Hub entitlement (available with the Advanced Security feature)
Procedure
-
Select Reporting > Inbound Activity.
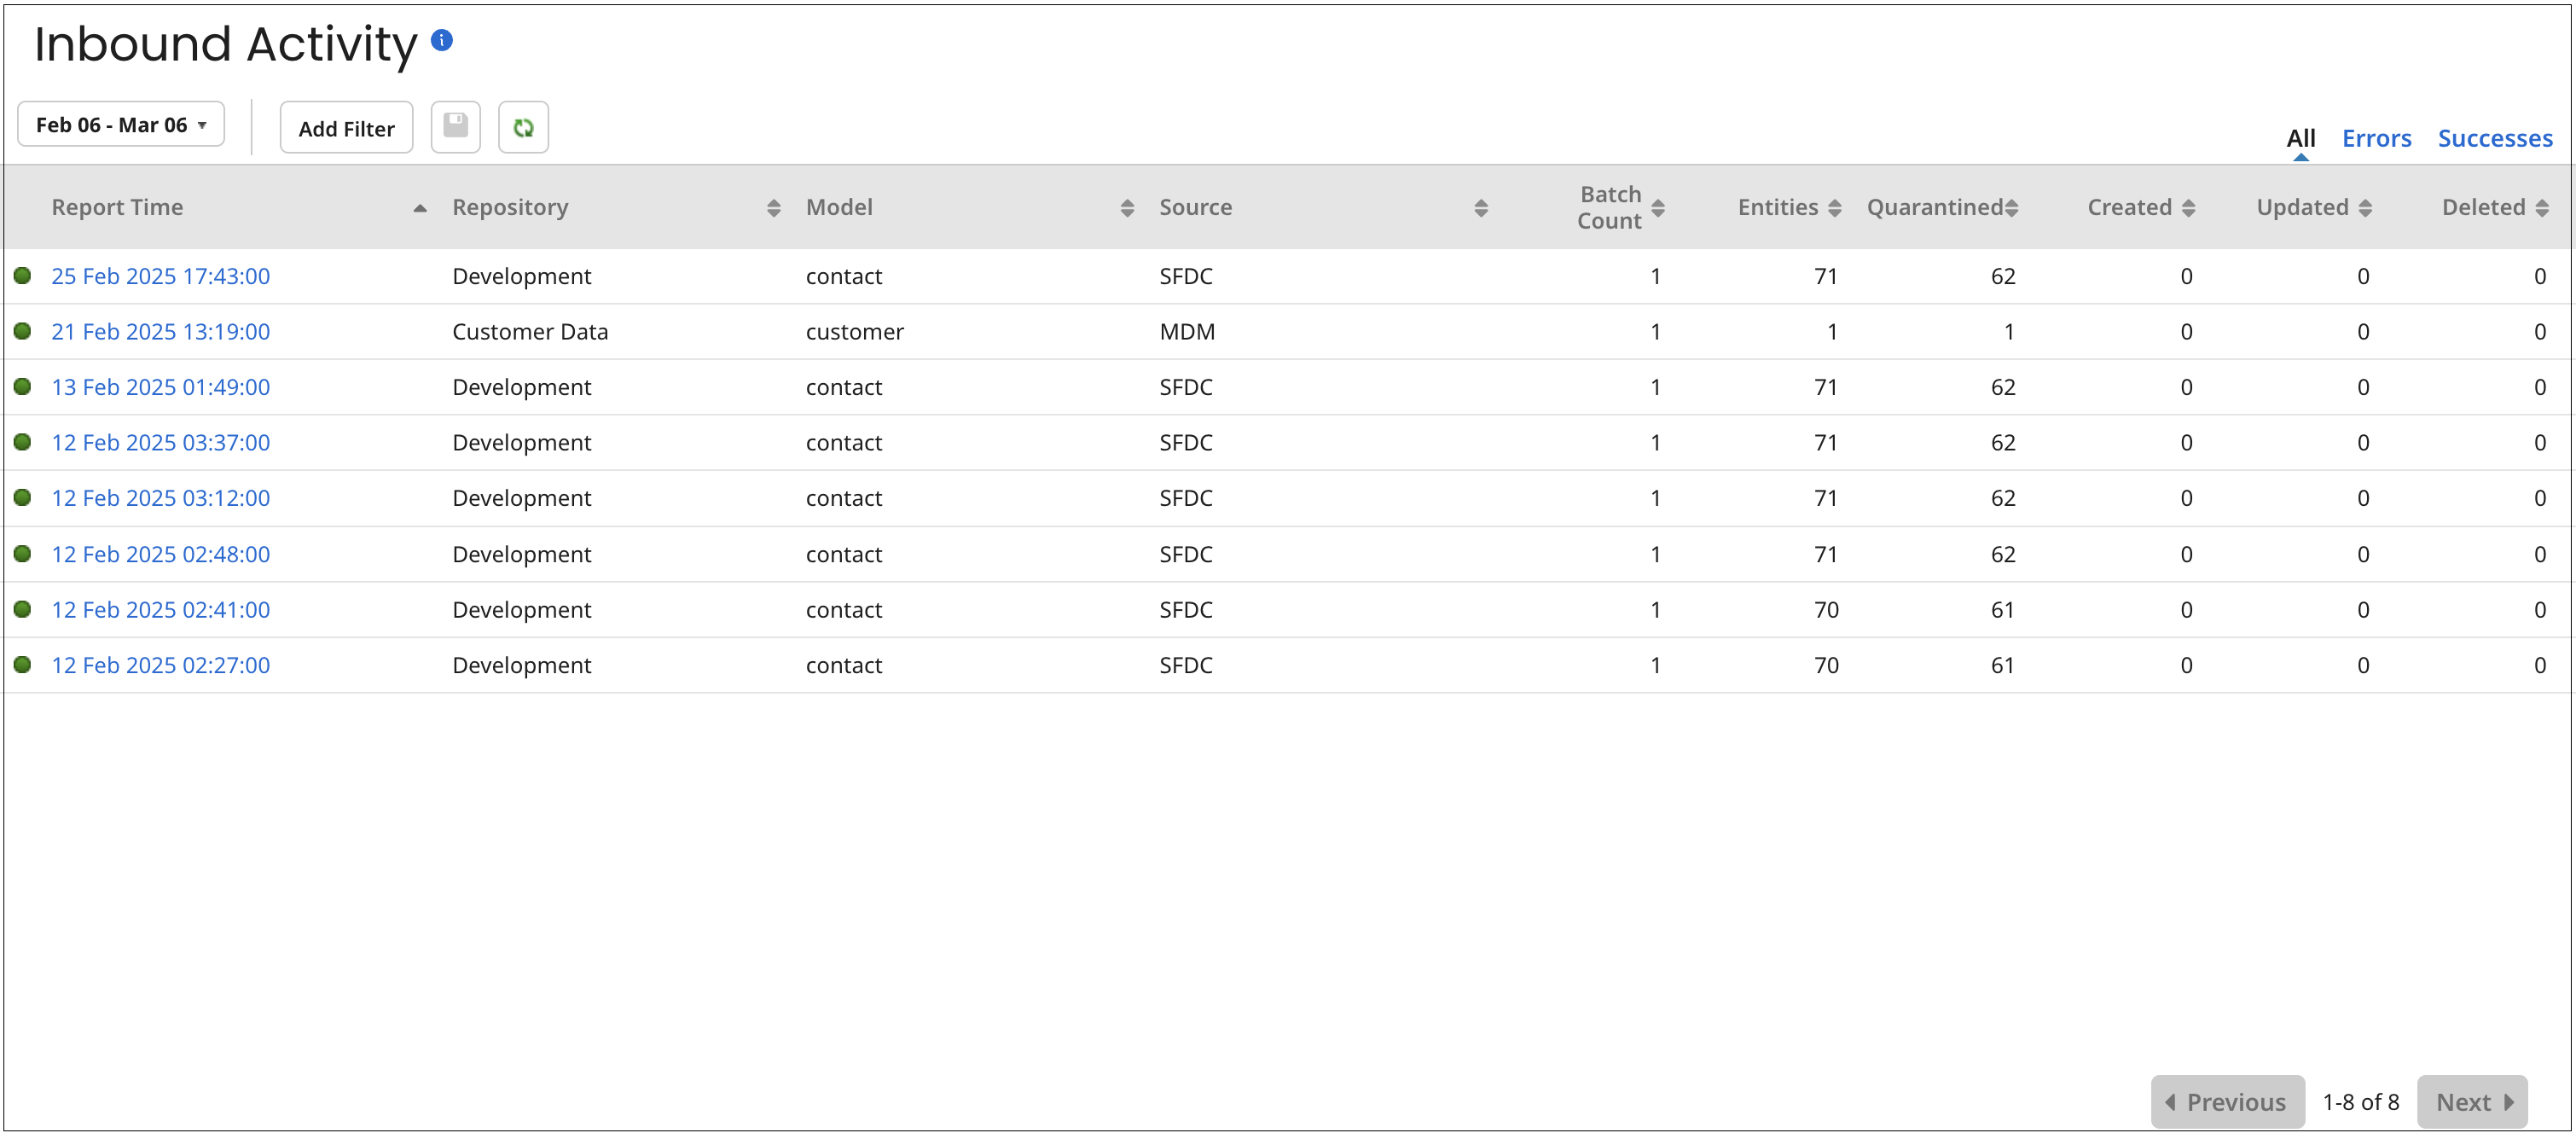
By default, inbound activity reports for the past hour are listed, unless a different time span has been explicitly saved as the default. Each listed report is associated with a specific repository, domain, and source — including both ordinary and staged batches processed within a one-minute span. The list is refreshed from the repository every five minutes and reflects any applied filters. You can refine the list further using a different time span or additional filters to the reports list.
When Boomi Data Hub receives a small entity batch, it may wait for a few seconds to collect additional batches, merge them, and process them under a single batch ID.
noteAny difference between the total entity count and the sum of quarantined entities and golden records created, updated, or deleted represents entities that were neither quarantined nor involved in any golden record operation.
By default, reports are listed from newest to oldest by Report Time. Click a column header to sort by that column and click again to reverse the sort order. You can refresh the list by clicking
 Refresh.
The colored dot icon next to a Report indicates the processing status of the subject batches:
-
 — All batches were processed successfully. This does not mean that no entities were quarantined. If you hover on the icon, you can see the status Success.
 -
 — At least one batch was processed with errors. If you hover on the icon, you can see the status Errors.
-
-
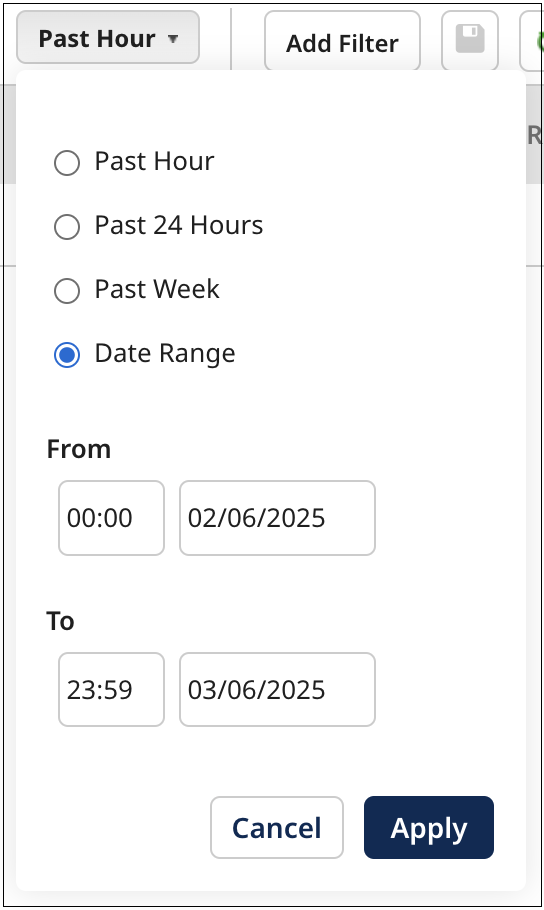
Optional: To apply a different time span filter to the reports list, click the time span filter button, select one of the following from the dialog and then click Apply:
-
Past Hour
-
Past 24 Hours
-
Past Week
-
Date Range - The default range is the past month, unless a different time span has been explicitly saved as the default. You can enter From and To dates manually, or click the date fields to select them from the calendar. Optionally, you can also select From and To times instead of using the default values of 00:00 and 23:59.
Steps 3–8 describe how to apply additional filters to the reports list. Each step corresponds to a specific filter type. When a filter is applied, a button for that filter appears to the left of the Add Filter button. The button’s label displays the selected criterion — for example, Source: (source name).
-
-
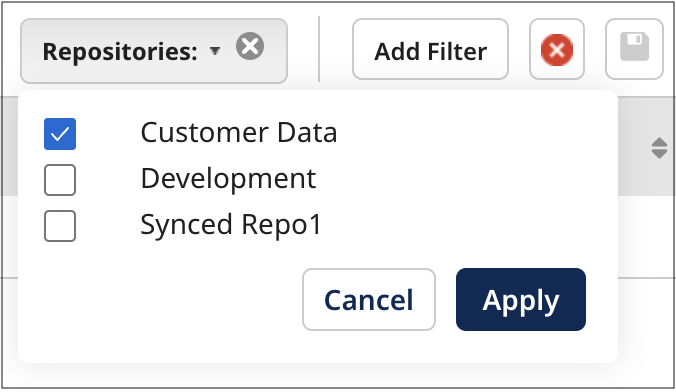
Optional: To filter the reports list by repository, do one of the following
-
If the list is not currently filtered by repository, click Add Filter, select Repositories, choose the check boxes for the repositories you want to include, and then click Apply.
-
If a repository filter is already applied, click the Repositories: button, update the selected check boxes as needed, and then click Apply.
If you want to see results for all repositories, do not apply the repository filter.
-
-
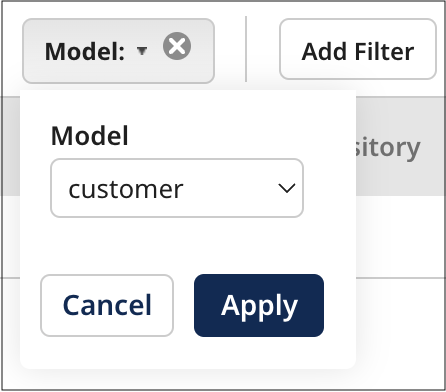
Optional: To filter the reports list by domain, do one of the following:
-
If the list is not currently filtered by domain, click Add Filter, select Model, choose the domain you want from the list, and then click Apply.
-
If a domain filter is already applied, click the Model: button, update the selection in the list as needed, and then click Apply.
-
-
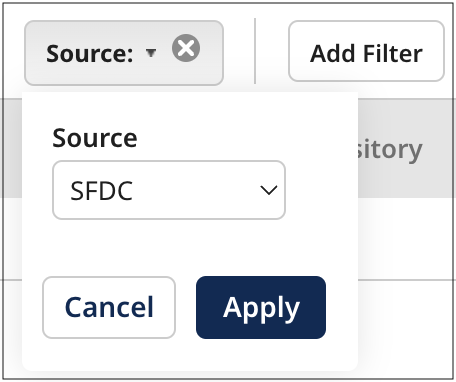
Optional: To filter the reports list by source, do one of the following:
-
If the list is not currently filtered by source, click Add Filter, select Source, choose the source you want from the list, and then click Apply.
-
If a source filter is already applied, click the Source: button, update the selection in the list as needed, and then click Apply.
-
-
Optional: To filter the reports list by batches from which entities were quarantined, click Add Filter and select the Has Quarantined Records filter type.
-
Optional: To filter the reports list by batches from which golden records originated, click Add Filter and select the Has Created Records filter type.
-
Optional: To filter the reports list by batches that resulted in the deletion of golden records, click Add Filter and select the Has Deleted Records filter type.
-
Optional: To clear the filters, do one of the following:
-
Click
 Clear on the filter’s button to remove an individual filter from your reports list.
 -
Click
 Clear All Filters to clear all filters you have applied.
-
-
Optional: To save the currently applied filters as your default view for the reports list when Batch Reporting reloads, click
 Save current filters as default view.
 -
Optional: To filter the reports list by batch processing result, click Errors or Successes. Select All to clear the filter.
-
Optional: To view report details, click the Report Time link in the reports list. The Batch Report detail view opens, which displays a summary of the report along with each line representing a batch.
The view is sourced from the repository and may take a few moments to load, depending on the volume of data. You can click and drag the
 icon on the view border to adjust its width.
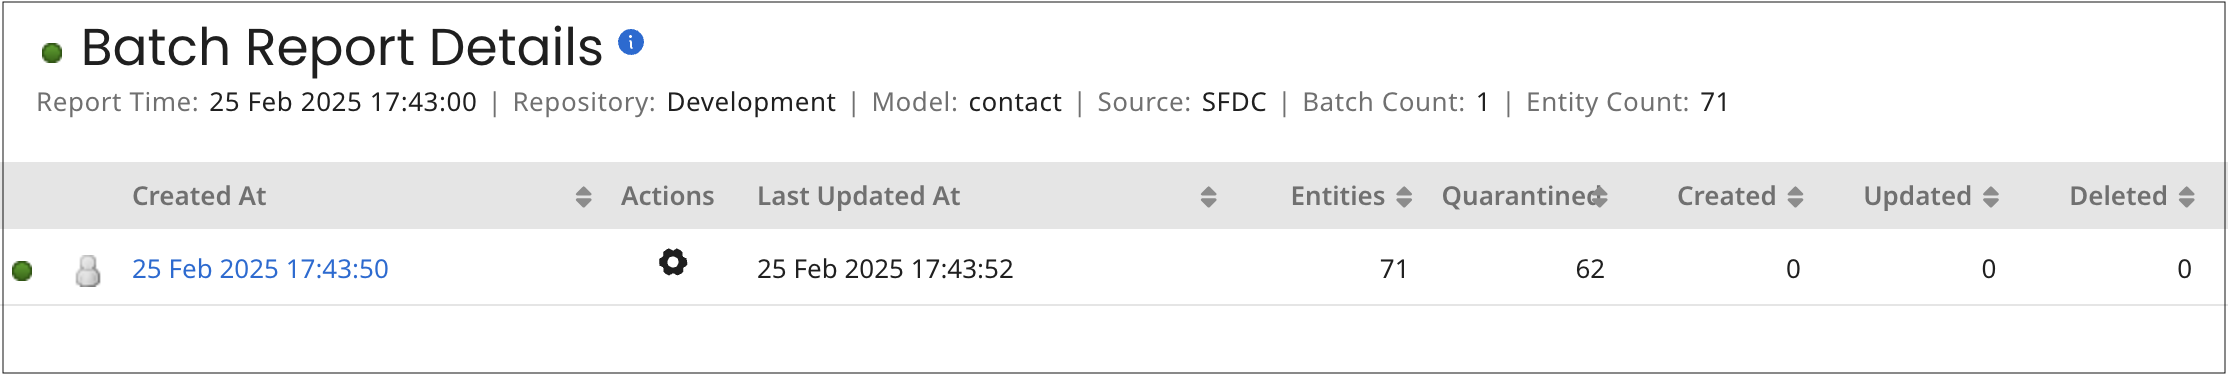
The icon displayed next to the Created At timestamp indicates the submission type, reflecting how the batch was originated:
-
 — The batch originated from the source. If you hover over the icon, you can see the status API for a contributed batch or Staging API for a staged batch.
 -
 — The batch was manually created. If you hover over the icon, you can see the following statuses:
- Manual Edit — a quarantined entity you edited and resubmitted.
- Manual Resubmit — one or more quarantined entities you resubmitted without any changes.
- Selective Merge — fields you selectively merged from a quarantined entity into a matching golden record
- Staging Commit — one or more staged entities you committed to the target domain.
- Staging Resubmit — one or more staged entities you resubmitted.
-
-
Optional: To view and perform the set of actions applicable to a batch report, do any or all of the following:
-
Select Batch Processing Details from the batch’s Actions
 menu to view processing details for the batch.
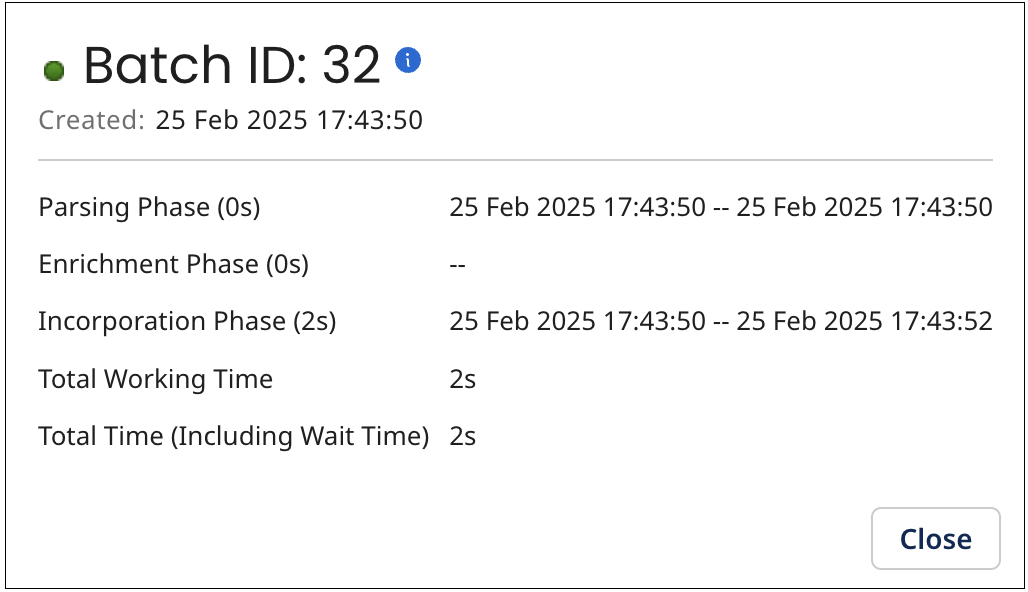
-
Select Resubmit Batch from the batch’s Actions
menu to resubmit the batch, then click OK in the confirmation dialog.noteThe Resubmit Batch action is available only to administrators and users with the MDM - Batch Management privilege.
-
Select View Process Execution from the batch’s Actions
 menu to view a report on the process that submitted the batch. This opens the Process Reporting page in a new browser tab or window, displaying only the relevant execution in the results table.
This option is not available for batches manually resubmitted from quarantined entities or those not submitted through a process execution.
-
-
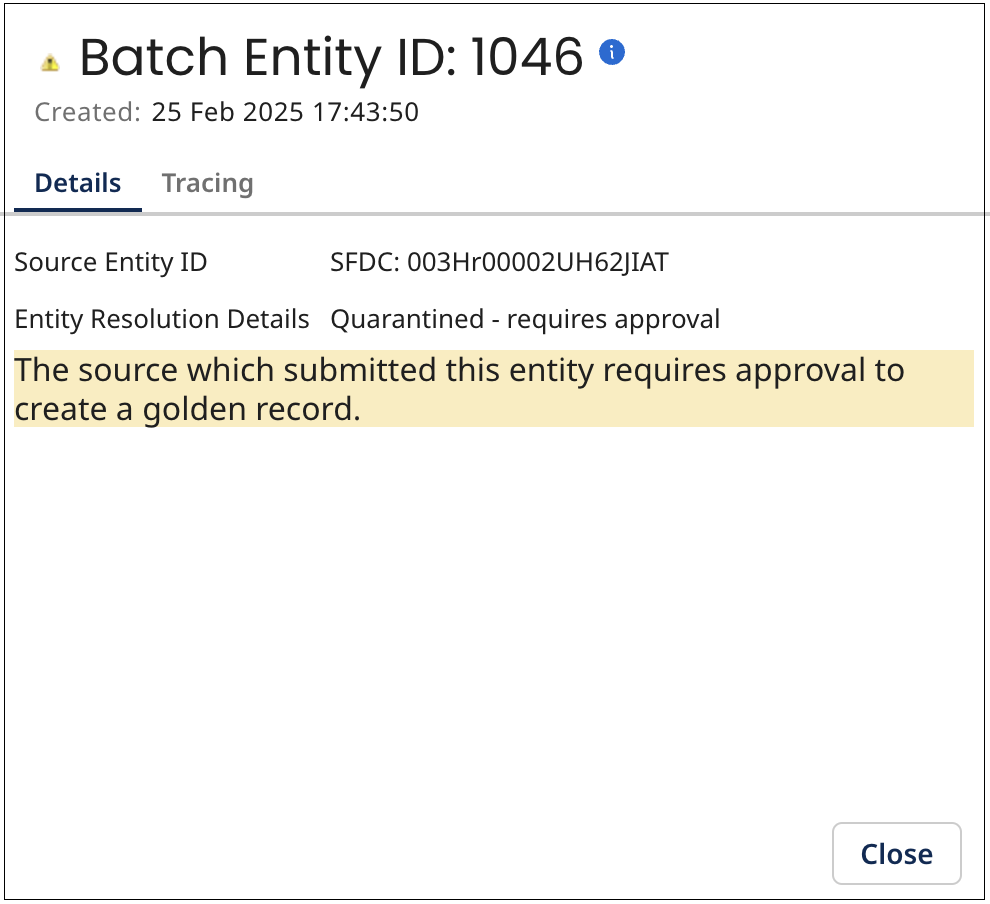
Optional: To view details about a batch, click the batch’s Created At link in the batches list. The batch detail view opens. In this view, each line represents an entity.
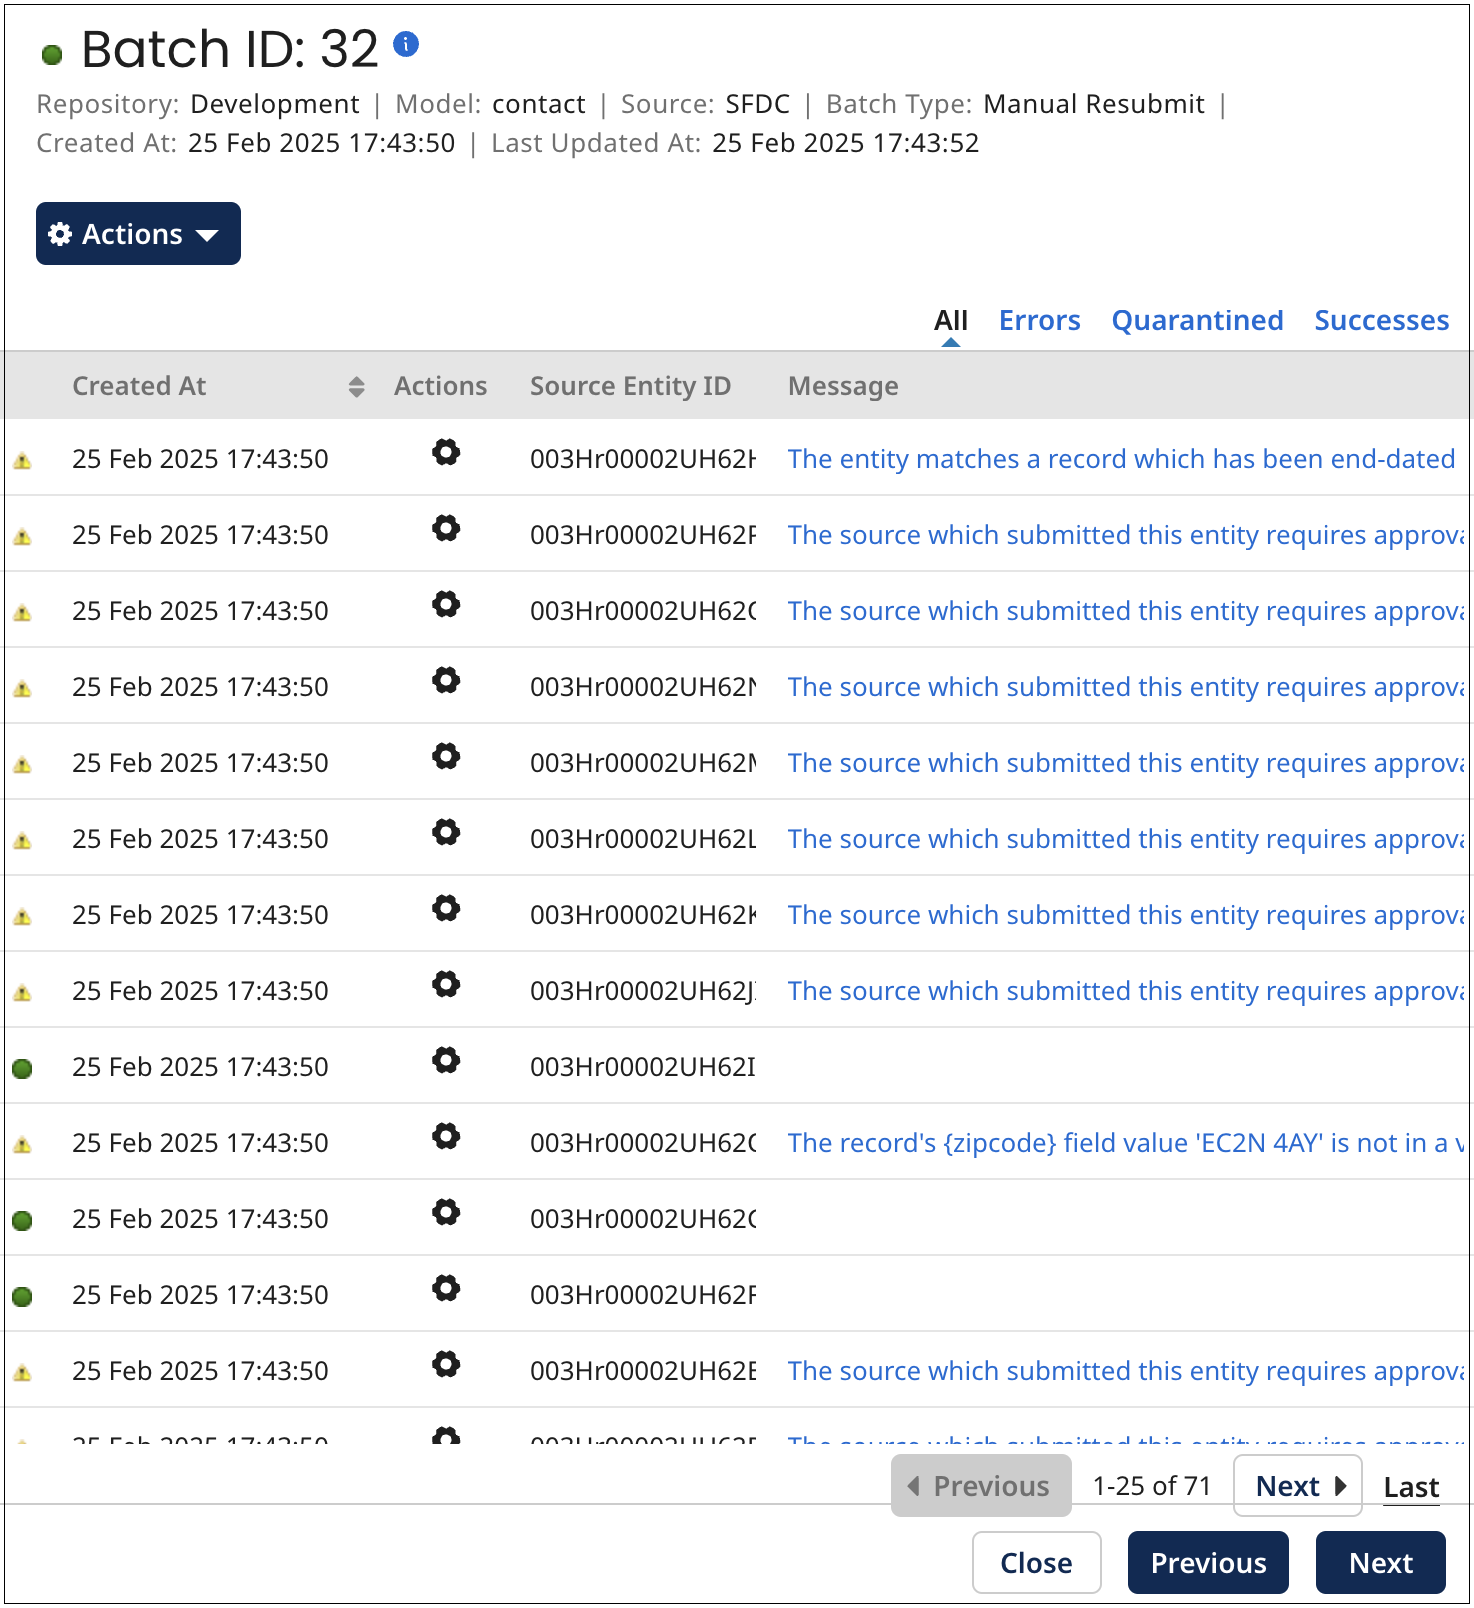
By default, the list is sorted by entity creation time from oldest to newest. Click a column header to sort by that column and click again to reverse the sort order. You can filter the batch list by processing result by selecting Errors, Quarantined, or Successes. Click All to clear the filter.
If the entity was quarantined, the reason appears as a Message link, and you can click the link to view it in a dialog.
The colored dot icon next to a Created At timestamp indicates the status of the entity:
-
— The entity was processed successfully. If you hover on the icon, you can see the status Completed.
-
 — The entity was quarantined. If you hover on the icon, you can see the status Quarantined.
 -
— The entity was processed with errors. If you hover on the icon, you can see the status Errored.
-
 — The entity is still being processed. If you hover on the icon, you can see the status Created, Parsed, Enriched, or Processing.
-
-
Optional: To view and perform the set of actions applicable to the entity, do any or all of the following:
-
Select Entity Processing Details from the entity's
Actions menu to view entity processing details. Refer to Entity processing trace for details.The details include Entity Resolution Details - such as golden record creation, linking to a source entity, quarantining, or no changes to domain data. If the entity was quarantined, the cause and reason are shown as a message. The Tracing tab provides XML-formatted details of applied match rules, data quality steps, and tags.
 note
noteTracing information is not available for a Delete (end-date) operation or if the entity was quarantined during the validation (parsing) phase.
-
Select View Entity from the entity’s Actions
menu to view an entity’s data. The Batch Entity dialog opens, displaying the Fields tab that shows the entity’s data fields and their corresponding values, reflecting the results of any successfully applied data quality steps.Collections are collapsed by default, and long text field values are represented by the
 View value icon. Click the icon to open a dialog that displays the full value.
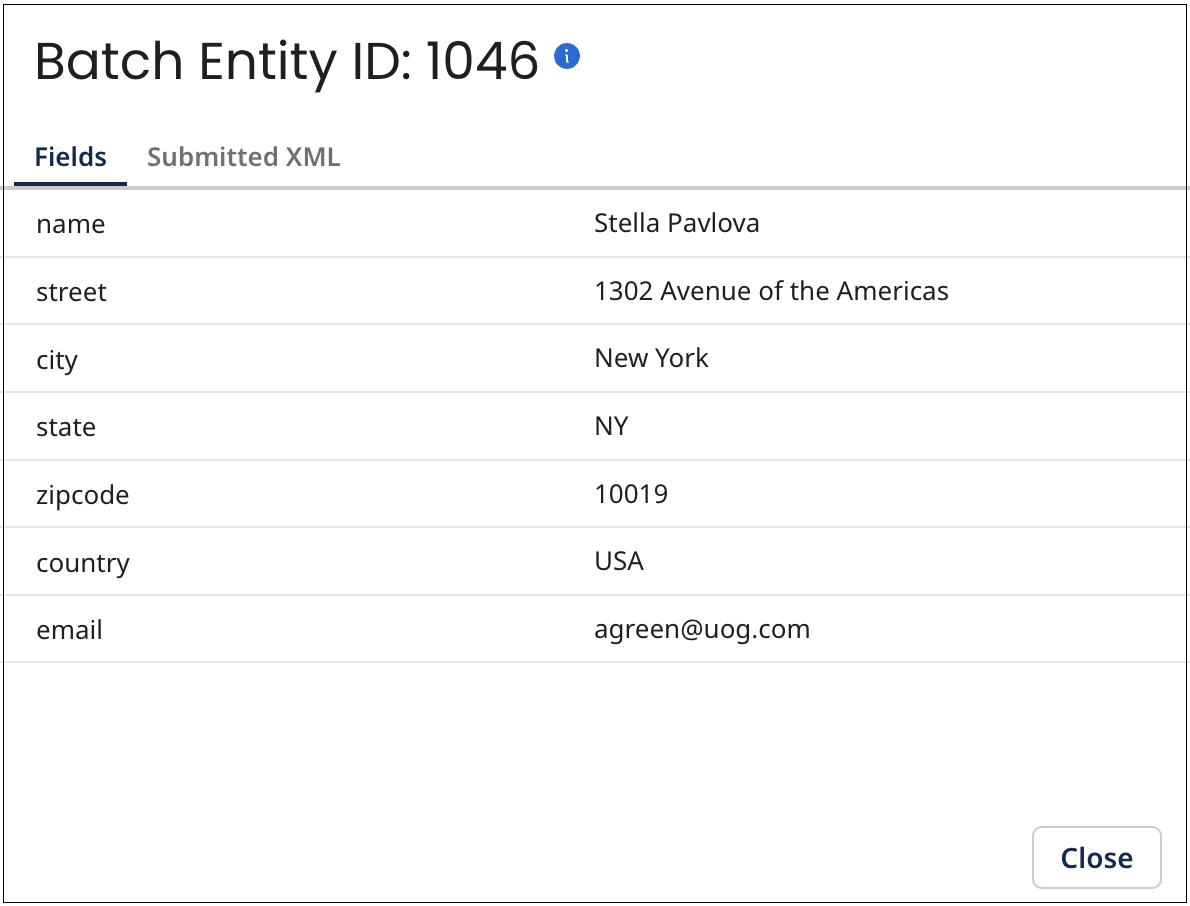
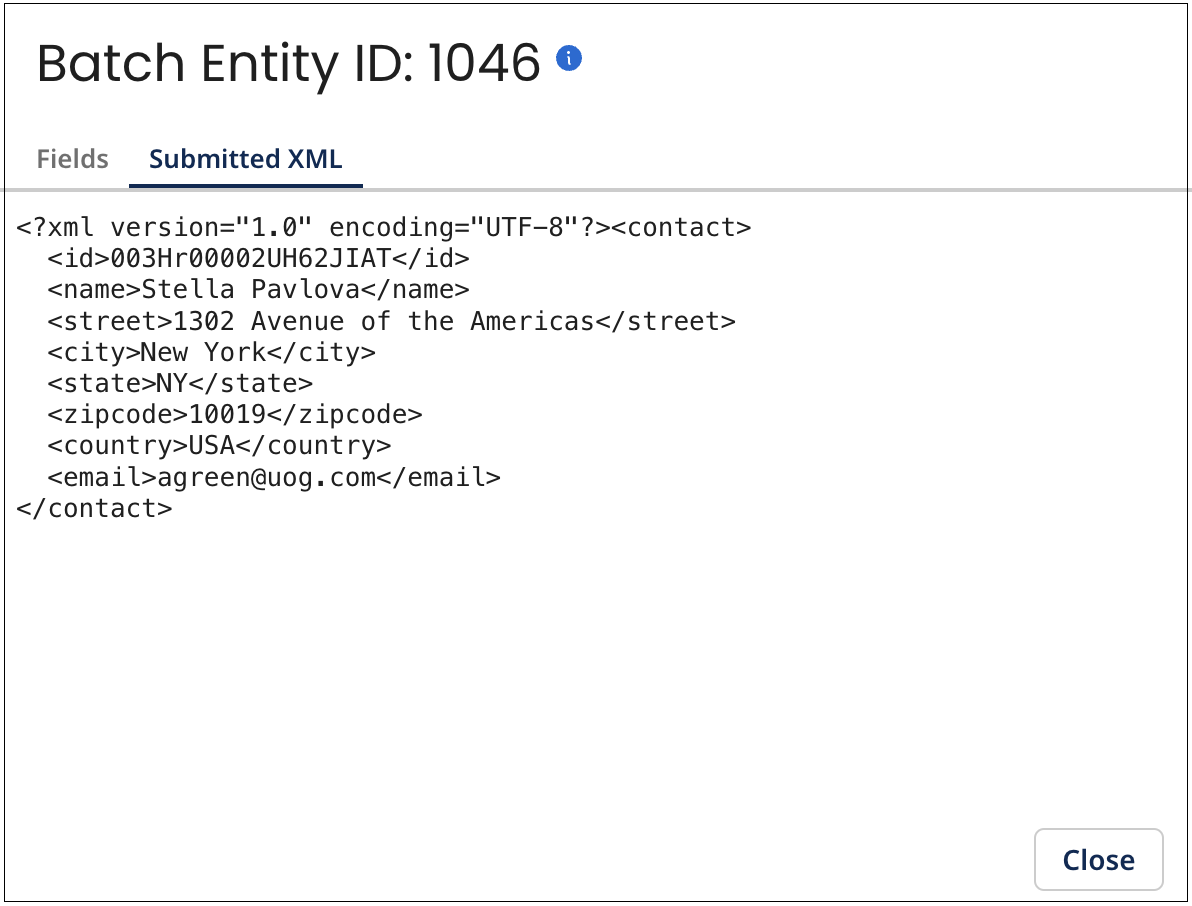
Select the Submitted XML tab to see the originally submitted entity data in the native XML format of the incoming batch.
 note
noteThe Submitted XML tab is not available when the entity source is from MDM via an Edit this record operation in the golden record detail view.
-
Select View Golden Record from the entity’s Actions
menu to view details for the golden record that was created, updated, or end-dated as a result of processing the entity, including the golden record that would have been updated if the entity had not been quarantined. -
Select View Transaction Details from the entity’s Actions
menu to open the detail view for the entity’s transaction, which displays information about the transaction status and history.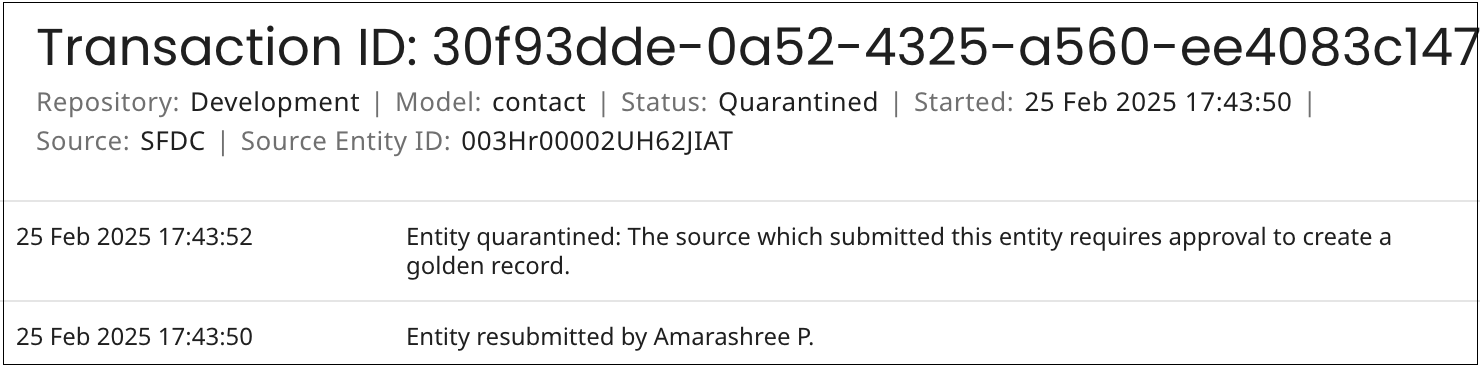
The transaction details consist of events that initiated the transaction and events that occurred during its processing, including — the contribution of the source entity in a batch, the quarantining of the entity and actions taken to resolve associated quarantine entries, and the outcome of incorporating the entity into the domain, which may involve the creating, updating, or end-dating of the corresponding golden record. Each event is timestamped, and they are listed from newest to oldest.
The transaction associated with the entity can be in any of the following statuses:
- Processing — the entity is currently being processed by Data Hub.
- Quarantined — the entity is quarantined and awaits manual resolution.
- Completed — processing has completed, resulting in a golden record being created, updated, end-dated, or retained without changes.
- Errored — processing failed due to an unexpected error.
- Deleted — quarantined entity was manually deleted, ending the transaction.
Transactions can be viewed for up to six months after completion. For transactions that did not result in any operation on a golden record, the view is available for 60 days. This option is not available for staged entities, as they do not have associated transactions. You can click and drag the
icon on the view border to adjust its width.When you are done viewing transaction details, close the transaction detail view — either press Esc, click Close or click elsewhere in Batch Reporting.
-
-
Optional: To view details for an entity, you can click the Source Entity ID if it appears as a link.
This opens the record in the source system in a new browser tab or window, provided that the source entity URL format is correctly specified in the Entity ID URL - either in the Sources tab for the source attachment or in the source definition in the Sources page.
-
Optional: When you are done reviewing the batch and entity details, do one of the following:
-
Close the batch detail view — either press Esc, click Close or click elsewhere in the Inbound Activity page.
-
Navigate to detail for the previous batch in the batches list — click
 Previous (or press the Up arrow key).
 -
Navigate to detail for the next batch in the batches list — click Next
 (or press the Down arrow key).
-
-
Optional: When you are done reviewing the report details, do one of the following
-
Close the report detail view — either press Esc, click Close or click elsewhere in the Inbound Activity page.
-
Navigate to detail for the previous report in the reports list — click
Previous (or press the Up arrow key). -
Navigate to detail for the next report in the reports list — click Next
(or press the Down arrow key).
-
Entity processing trace
You can view entity processing trace information in the Entity Processing Details dialog. To access it, go to the entities list in the Batch detail view. The information appears in XML format.
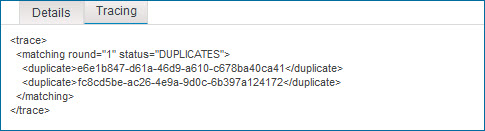
The root element is <trace> and its structure is as follows:
<trace>
   <matching round="" status="">
      <duplicate></duplicate>
      .
      .
      .
      <duplicate></duplicate>
      <unlinkedMatch></unlinkedMatch>
      .
      .
      .
      <unlinkedMatch></unlinkedMatch>
   </matching>
   <tag></tag>
   .
   .
   .
   <tag></tag>
   <dqstep>
      <name></name>
      <connector></connector>
      <operation></operation>
      <success></success>
      <change name="" value=""/>
      .
      .
      .
      <change name="" value=""/>
   </dqstep>
   .
   .
   .
   <dqstep></dqstep>
</trace>
Each of the following sections describes one of the direct descendants of <trace>.
Matching
The <matching> element specifies the result of the application of match rules to the entity. If the entity updates a golden record already linked to the source, match rules were not applied, and this element is therefore not present in <trace>.
The element has the following attributes:
@round
: This attribute is populated only if the application of match rules found one or more matching golden records. Its value is the sequential number of the match rule whose application resulted in a match. For example, if a match were to be found as a result of the application of the second match rule, the value would be 2.
@status
: The outcome of the application of match rules. These are the possible values:
-
AMBIGUOUS— 10 or more matching golden records were found (1,000 or more in the case of an exact matching expression grouped with a fuzzy matching expression), and the entity was therefore quarantined. The Ambiguous Match error shows golden record IDs for 10 sample matches to help resolve issues. To view the Ambiguous Match error, click on a quarantined date in Stewardship > Quarantine > Total Entries and navigate to the Activity tab. -
DUPLICATES— One or more matching golden records already linked to the entity’s source were found, and the entity was therefore quarantined. This value is used even if one or more matching golden records not yet linked to the entity’s source were also found. -
MATCH_FOUND— If the entity’s source is configured to disallow multiple links from individual golden records to entities in the source system, one matching golden record not yet linked to the entity’s source was found. If the entity’s source is configured to allow multiple links, one matching golden record not yet linked to this particular source entity was found. Unless the entity was quarantined, it was eligible for incorporation in the domain as an update to the matching golden record. The update would have included the establishment of a link from the golden record to the source entity. -
MULTIMATCH— Multiple matching golden records not yet linked to the entity’s source were found, and the entity was therefore quarantined. -
NO_MATCHES— There were not any matching golden records. Unless the entity was quarantined, it was eligible for incorporation in the domain as a new golden record.
The element has the following direct descendants:
<duplicate>
: There is an instance of <duplicate> for each matching golden record already linked to the entity’s source. Each instance contains the ID of the matching golden record.
<unlinkedMatch>
: There is an instance of <unlinkedMatch> for each matching golden record not yet linked to the entity’s source. Each instance contains the ID of the matching golden record.
<tag>
Each instance of the repeatable <tag> element specifies a tag applicable to the entity data. The tag is specified by name if it exists in the currently deployed version of the domain model. Otherwise, the tag is specified by its system ID. This element is present in <trace> only if one or more tags defined in the target domain model are applicable to the entity data.
<dqstep>
Each instance of the repeatable <dqstep> element specifies the outcome of the application of a data quality step. This element is present in <trace> only if data quality steps were applied.
The element has the following direct descendants:
name
Name of the step.
connector
(Ordinary steps only) system name of the data quality service connector for the service used in the step.
operation
(Ordinary steps only) Name of the data quality service operation used in the step.
success
Result of the application of the step. For business rule data quality steps, the value is true. For ordinary steps these are the possible values:
-
true— No errors were returned by the data quality service. The entity may have been quarantined for another reason, though. -
false— The data quality service returned errors, and the entity was therefore quarantined.
change: (Ordinary steps only) An instance of this empty element is present for each field changed as a result of output received from the data quality service operation used in the step. The element has the following attributes:
@name
Name of the field whose value changed.
@value
The field’s new value.
