Reports
The Activity Page features an Export option. You can export the report with the applied filter in a CSV file.
After setting the date range on the Activity Page, you must check for files removed by retention by clicking Show Purged Files before exporting.
After clicking Export, an icon will appear in the bottom right corner of your screen, providing options to either download the export directly or navigate to the Reports view.
When you click the export button, report generation is queued based on the data volume. Consequently, if you leave, log out, or return later, you can download the report from the Reports dashboard.
The Actions menu lets you download selected reports, view the filters applied during export, or visualize the data.
Reports will be deleted from the cloud 24 hours after their generation.
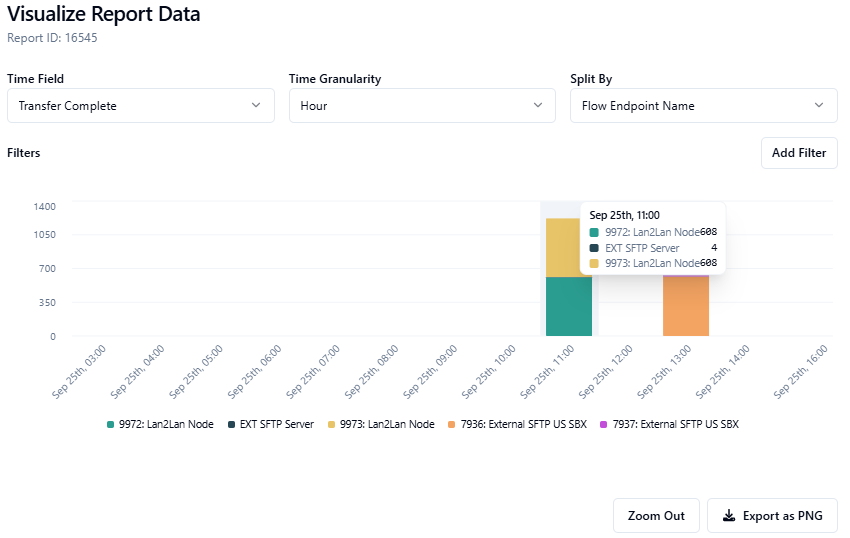
Visualize data
The Visualize Data option is available under the Actions menu. The system extracts data from the report and transforms it into a customizable graph.
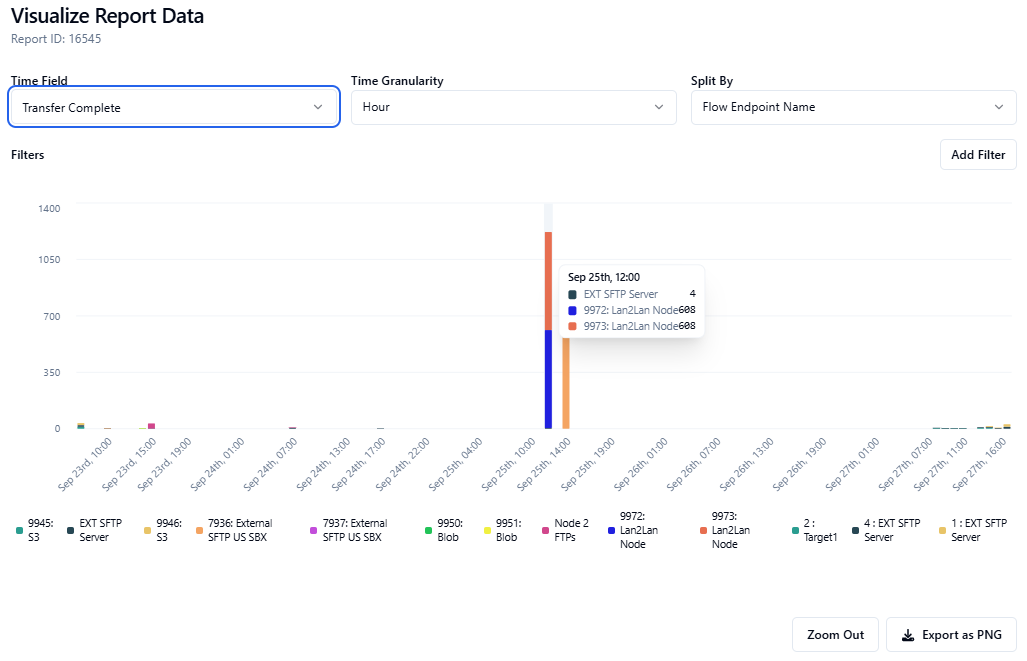
By clicking and dragging over specific sections of the report, you can zoom in to focus on that area. To return to the original view, click Zoom Out.
You can apply various filters to limit results in the visualization—for example, Flow Name, Flow Endpoint type, or Filename.
After selecting time ranges and filters, you can click Export as PNG to download the current visualization as an image.
