Viewing process execution details
Process execution details include status, time, execution types, and documents with errors.
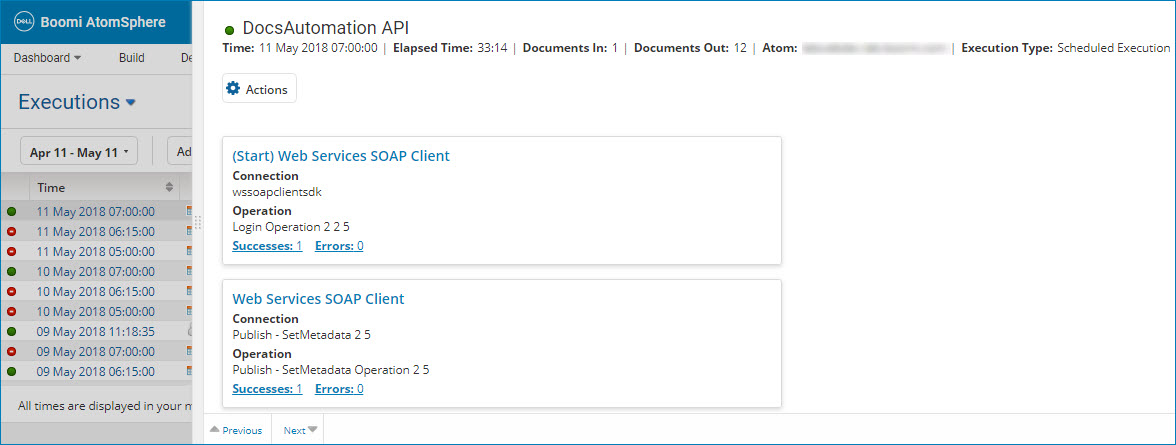
When you click a date/time link for a process execution within the execution results table, you will see the detailed view for that specific execution.
You can adjust the width of the view by clicking and dragging the detail border.
The top of the view shows the process name with a status icon that indicates whether the process is ongoing or has completed. For in-progress processes, you might see one of the following tooltips:
- Starting - The process is starting. Processes start so quickly that it is unlikely that you will see this tooltip.
- Enqueued - If the number of simultaneous process executions per node exceeds the limit, the process is in the queue. This tooltip applies only to non-low latency process executions. You can cancel a queued process execution.
- Pending — The process is pending completion. You can cancel a pending process execution.
If the process has completed, one of the following icons displays:
-
 The process and all documents were processed without errors.
 -
 There was at least one wrning in processing one or more documents. This status applies to low latency processes.
 -
 There was at least one error in processing one or more documents, the process was aborted, or the process was discarded.
Other information about the process includes:
-
Time - The date and time at which execution began. The date and time are in the format yyyy-MM-dd hh:mm:ss aa, using the time zone in which you are accessing the UI.
-
Elapsed Time - The duration of the execution in minutes and seconds (mm:ss).
-
Documents In - The number of documents read into the process. A single document can represent a batch containing many individual records.
-
Documents Out - The number of documents sent out of the process. This number represents an aggregate of all the documents sent by a Send connector. If a single document is sent to multiple outbound connectors, it is counted for each. Splitting and combining documents within the process has a direct affect on this value.
-
Runtime - Name of the runtime on which the process ran.
-
Execution Type - Indicates how the execution was triggered:
-
Error description - If the execution failed, a truncated version of the document or process error message is shown on a pink background. This is a link to the Document Error detail view or the Process Error detail view.
Actions menu
Clicking Actions opens a menu containing the following selections:
-
View Process Logs - Opens the Show Log dialog for viewing events recorded during the execution. If a process does not execute, because it was discarded or because the user tried to execute it when it was already running, a log is not created. If that is the case, View Process Logs is not available.
-
View Process - Opens the process component in a new browser tab or window.
-
View Deployment Components - Opens the Components in this Deployment Version dialog for viewing a list of the components used during the execution.
-
View Process State - Opens the View Process State dialog for viewing the sequence in which steps were executed and the time it took to execute each step.
-
View Extended Information - Opens the Extended Execution Information dialog for viewing the IDs of the execution, process, runtime and deployment.
-
Cancel Process Execution - (Pending executions only) Initiates a request to cancel the execution. An alert box informs you that cancellation may take up to a minute and in the meantime the execution may complete successfully.
Connection documents list
For each connection that occurred during the execution, the following information and links are available:
-
Name - The connector type or, for a trading partner, the document standard.
If the step is the Start step, the prefix “(Start)” appears here.
This is a link to the unfiltered connection documents list, which shows metadata for documents processed through the connection during the execution and provides a means for viewing the data in the documents and rerunning documents.
-
Connection - For a connector step, the name of the connection component. For a trading partner step, "Trading Partner".
-
Operation - For a connector step, the name of the connector operation component. For a trading partner step, the communication method.
-
Successes - Count of documents successfully processed through the connection. This is a link to the connection documents list filtered to include only these documents.
-
Errors - Count of documents with errors processed through the connection. This is a link to the connection documents list filtered to include only these documents.
Clicking a connection gives you the ability to re-run documents or re-run documents in test mode and view additional details about each connection document.
Documents with errors
Each row represents a document with errors processed in the Start step and displays the following information. If there are more than five documents with errors processed in the Start step, only the first five are represented.
-
ID - The unique document ID. This ID is specific to the execution.
-
Red Status Icon - Indicates there was at least one error in processing the document.
-
Actions - This menu contains the following selections:
- View Logs — Opens the Show Log dialog for viewing events logged during the processing of the document.
- View Document — Opens the Document Viewer dialog for viewing the data in the document.
- Re-run Document — Initiates a request to rerun the document.
- Run Document in Test Mode — Initiates a request to rerun the document in Test mode.
- View Linked Documents — Opens the View Linked Documents dialog for viewing linked documents processed through previous or subsequent connections.
-
Error Message - A truncated version of the error message. This is a link to the Document Error detail view.
-
Size (kB) - The file size in KB.
Additional document metadata shown here is dependent upon the document type.
-
For documents retrieved using Disk connector operations, the following additional metadata are shown:
-
Directory - The directory, on the system on which the runtime resides, from which or to which the document was read or written.
-
File Name - The document filename.
-
-
For descriptions of trading partner document metadata, see the topic about the Trading Partner results table.
-
For descriptions of metadata for documents retrieved using other types of connectors, see the connector topics.
Clicking an error message opens a detail view for the error. Process errors record the overall execution for all documents processed; whereas document errors record the execution of a single document. Depending on the nature of the failure, the detail may apply either to a specific document or to the execution.
The document error details includes the following tabs:
- Error Details
- Resolve Agent
This tab shows the following information about the error and its context. If you need to submit a support request for help with the error, copy and paste the contents of the tab, including the Stack Trace, into the request.
-
Execution ID - ID of the execution.
-
Process - Name and revision level of the executed process. This is a link to the process, which opens in a new browser tab or window.
-
Step Type - The type of step in which the error occurred.
-
Step - The names and revision levels of components used in the step in which the error occurred. Each component name/revision pairing is a link to the component, which open in a new browser tab or window.
-
Doc References - Documents referenced by the error message. Clicking a link to a referenced document opens the Document Viewer dialog for viewing the data in the document.
-
Stack Trace - This identifies the location in code in which the error occurred.
This tab shows as many as 10 possible solutions to the error, in descending order of relevancy.
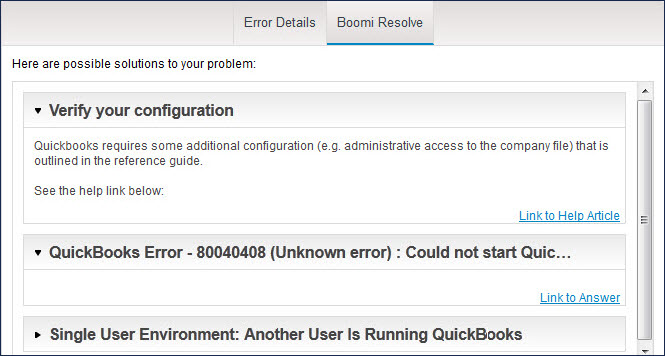
Clicking the expand icon adjacent to a solution heading shows solution detail, including links to articles in the Boomi Community.
For additional information on viewing document logs and process logs, refer to Viewing a document log and Viewing a process log.
