Dashboard
The Dashboard page provides a dashboard view of all the flows launched within your tenant, and allows you to drill down into individual flows to view detailed flow state, log and root fault information.
Opening the page
- Select Dashboard from the left-hand menu.
Page overview
-
The dashboard is divided into two main areas:
-
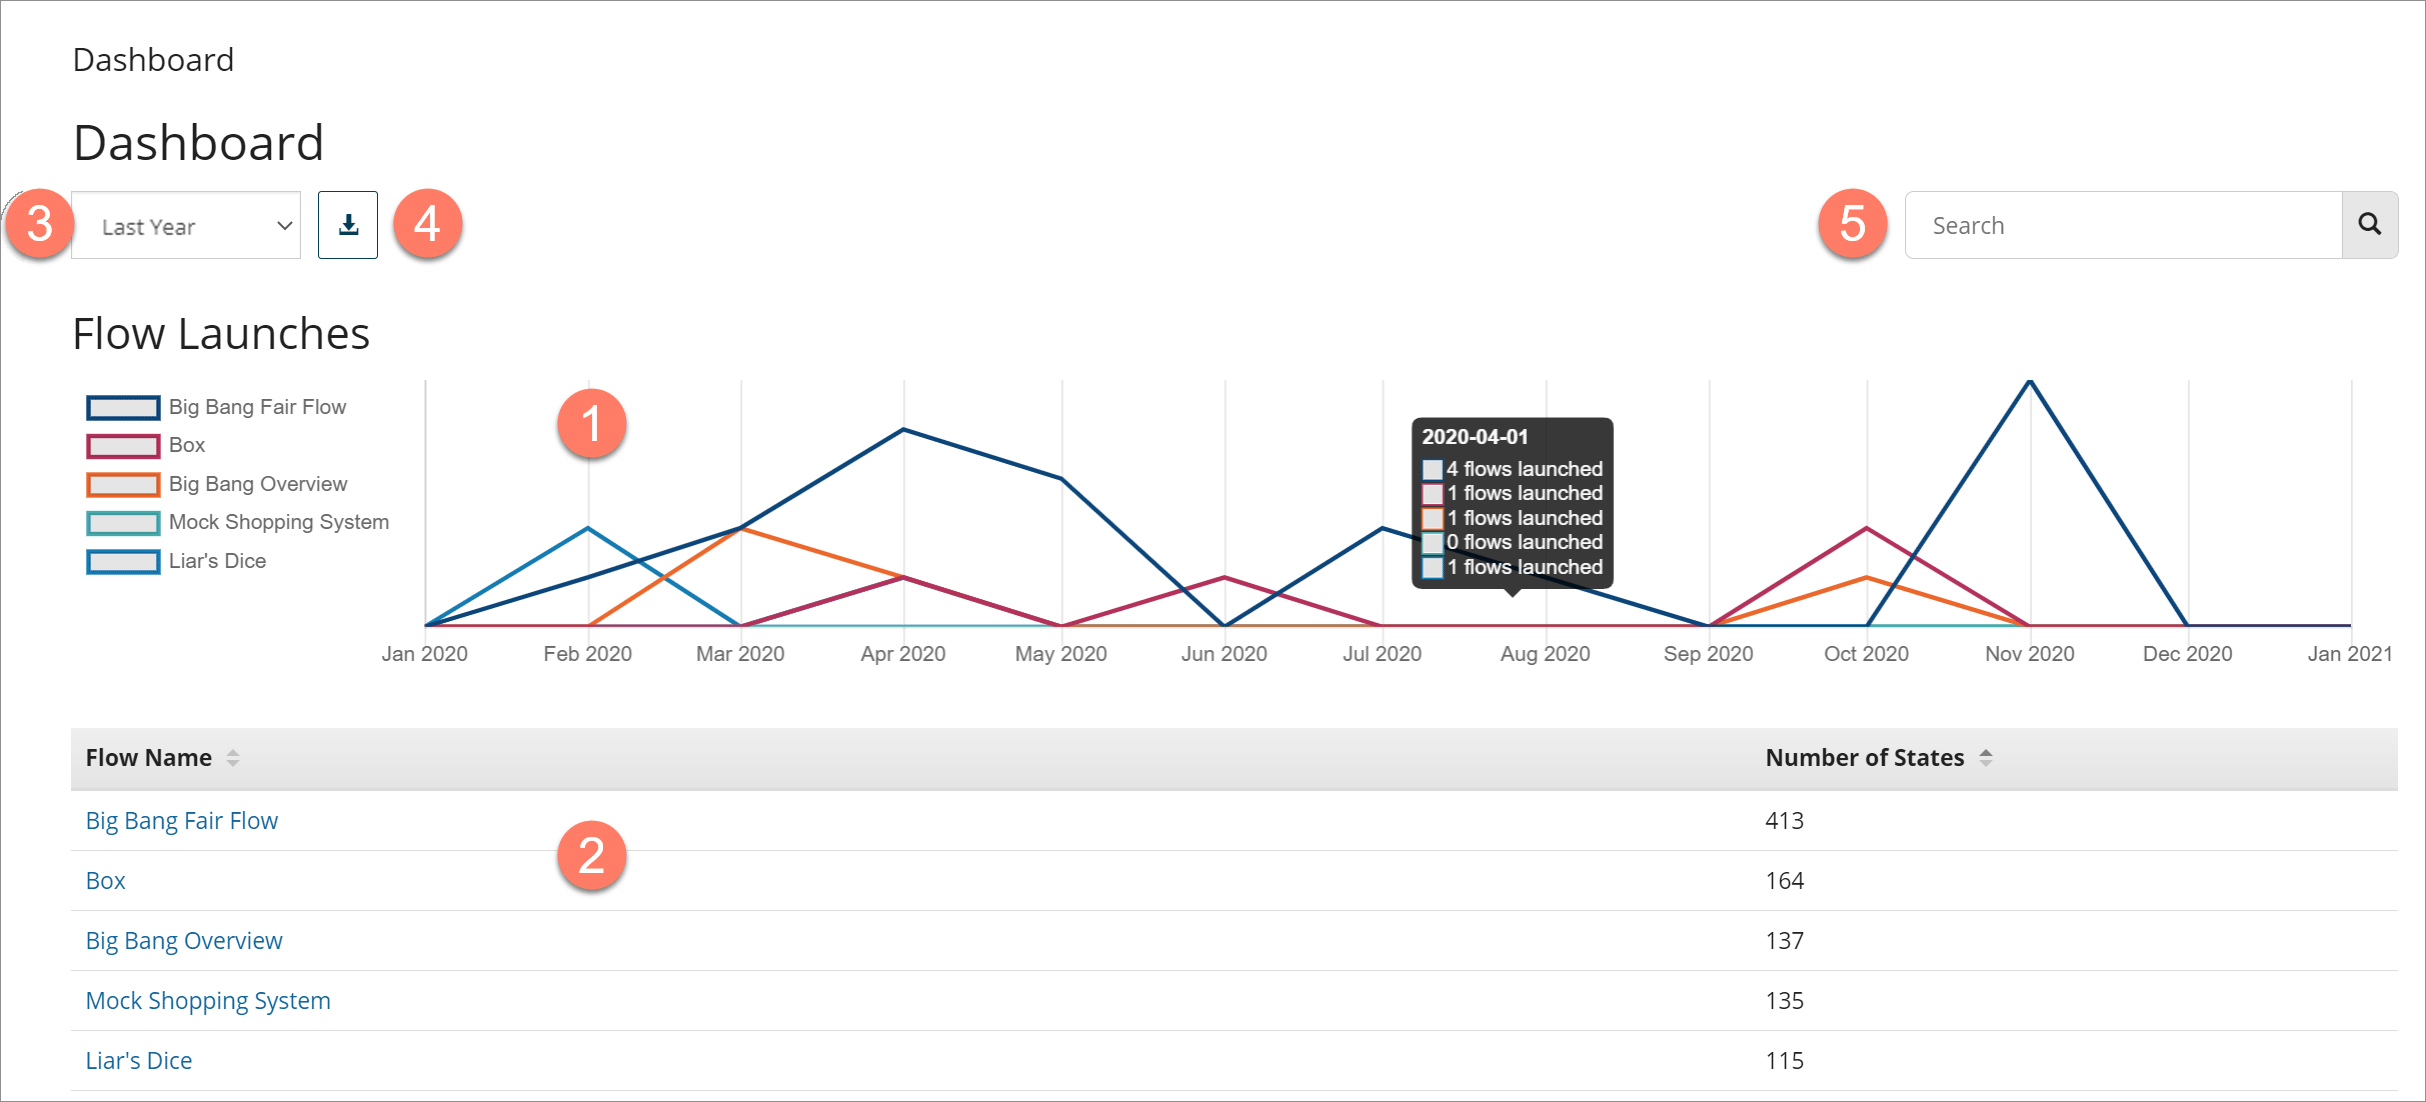
The Flow Launches chart
 in the upper half of the page provides a visual overview of the number of times the top 5 most launched flows have been launched within the selected date range. Hover over a date on the chart to view details of the number of launches.
 -
The Flow States table
 in the bottom half of the page provides a list of all the flows that have been launched and how many states have been created for each flow. Click on a flow in the Flow Name column to open the Insight page and view details of the individual flow states for the flow.
-
-
The date range for the dashboard is selected in the Date Range drop-down menu.

-
Click the Download results in CSV format icon
 to download the dashboard results as a .CSV file.
 -
Filter the page results by searching for specific flows using the Search field.
 The Flow Launches chart and the Flow States table update to show only information for the flows that match your search.
 -
Flows are automatically added to the dashboard once they have been created.
