Snapchat Marketing walkthrough
This integration empowers marketers to seamlessly gather, centralize, and analyze Snapchat campaign data with other marketing data sources. By leveraging Data Integration features, marketers can optimize their Snapchat marketing strategies, track campaign performance, and derive actionable insights to drive business growth effectively.
Connection
- To connect Snapchat Marketing with your destination, refer to Snapchat Marketing connection topic.
- Choose the Source connection after creating the Snapchat Marketing connection.
Predefined reports
Data Integration provides a convenient entry point and recommended approach for accessing a range of predefined reports. Each report includes a concise data description, a list of customizable fields (if applicable), and the schema mapping.
These reports use a standardized format, so the platform locks certain fields and only allows access through Custom reports.Custom Reports.
Custom reports
Select a specific report to pull data from the Snapchat Marketing.
You can split several reports into stats reports (with stats as a suffix) and non-stats reports. Start to build the Snapchat data integration Data Flow by selecting the report you wish to pull.
- Ad Accounts
- Ad Squad Stats
- Ad Squads
- Ad Stats
- Ads
- Audience Filters
- Campaign Stats
- Campaigns
- Creative
- Funding Sources
- Media
- Organizations
Stats reports
- Three stats reports are available: Campaign, Ad Squad, and Ads.
- The campaign stats report has the highest granularity, while the ads have the lowest. The ads stats report also has the most possible configurations, so we will focus on this report.
Procedure
- Select the report.
- Select the required organizations or leave the input empty to pull from all organizations. An organization is the highest entity in Snapchat, which represents a partner, ad agency, or brand.

- Select the required ad account or leave the input empty to pull all ad accounts. An Organization owns an Ad Account, which contains Ad Campaigns.
- Select the required campaign or leave the input empty to pull all campaigns. A campaign has business objectives and organizes Ad Squads.
-
Select the desired granularity. The metrics return according to the chosen granularity. Day and Hour granularity requires choosing a date range, while Total and Lifetime do not.

-
You can also select a dimension and a pivot. A specific dimension returns reporting insights based on that dimension. If you select a dimension, an additional input called pivot appears. The additional pivots you select filter the data within a dimension.
The list of supported fields(metrics) is shorter than the default list.
- Select attribution windows. The attribution window is the time period during which Data Integration counts a conversion after a user sees an Ad. By default, the attribution windows are 28 days post-swipe and 1 day post-view.
 Not all combinations of attribution windows are allowed. In the table below, you can view the allowed combinations:
| View window | Swipe window 1_DAY | Swipe window 7_DAY | Swipe window 28_DAY |
|---|---|---|---|
| 1_HOUR | Allowed | Allowed | Allowed |
| 3_HOUR | Allowed | Allowed | Allowed |
| 6_HOUR | Allowed | Allowed | Allowed |
| 1_DAY | Allowed | Allowed | Allowed |
| 7_DAY | Not Allowed | Allowed | Allowed |
| 28_DAY | Not Allowed | Not Allowed | Allowed |
- Select the Fields(metrics).
- Select the time period of the report. It can be a custom date range or a defined time period.
- Select the time period of the report. It can be a custom date range or a defined time period.
- If you select Date Range:
- Select the start date and end date.
- Leave the end date empty to pull data until the Data Flow runs.
- After each run of the Data Flow, Data Integration automatically updates the start date with the end date, and updates the end date with the empty value. This enables the next run to pull data from the end of the previous run.
- Select the time zone offset. It is relevant only if the end date is empty to find the moment of the Data Flow’s run according to the time zone.
- Days back - use this input to pull data from a given number of days back before the given start date.
- The Start Date does not advance if a Data Flow run is unsuccessful.
If you do not want this default setting, click More Options and select the checkbox to advance the start date even if the Data Flow run is unsuccessful (not recommended).

- If you select any other value:
- If you select Date Range:

- Select the timezone offset to send the correct dates that consider that offset.
Non stats reports
Non stats reports are simple and require fewer configurations than the stats reports. Depending on the report, these entities are optional: organizations, ad accounts, and campaigns.
Example - Ad report
The ad reports pull information about ads.
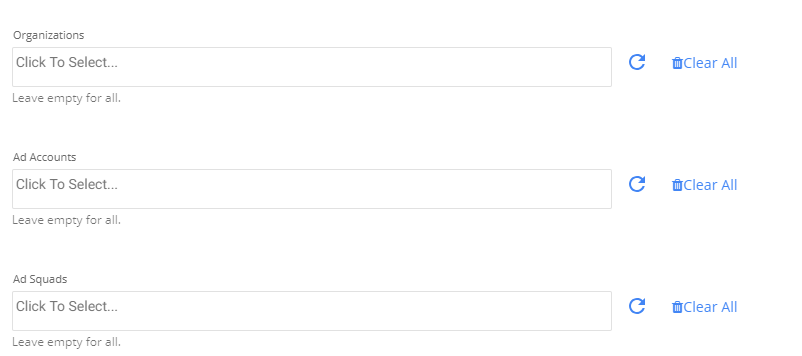
- The report has three options: organizations, ad accounts, and ad squads.
- Leaving all the options empty pulls data from all organizations, ad accounts, and ad squads.
- To filter specific ad accounts or ad squads, you must fetch the list of desired entities and select the required entities.
Rate limit
The Snapchat Marketing API enforces rate limits to maintain the stability of its infrastructure.
These limits operate on two levels: the App and Token levels. The App can handle an average of 20 requests per second, while the App limits individual Access tokens to an average of 10 requests per second.
When you reach the rate limit, you encounter an HTTP 429 Too Many Requests response. If your application consistently triggers HTTP 429 errors, you must reduce the rate at which your App sends requests to the API.
