Google Analytics 4 walkthrough
Google Analytics 4 (GA4) on Data Integration provides seamless integration of GA4 data into data warehouses. This integration automates data extraction, enabling efficient analysis.
Prerequisites
- Active Google Analytics account.
- A valid Google Analytics connection in Data Integration.
Connection setup
To connect Google Analytics 4 (GA4) with your destination, follow the step-by-step tutorial.
- Source connection: Select your existing Google Analytics connection or create a new one.
- Data Flow mode: Choose between Predefined Reports or Custom Report.
- API version: Select Google Analytics 4.
Configure property scope
You can define the scope of data retrieval using the GA4 Accounts and GA4 Properties fields.
Leaving the GA4 Properties field empty triggers the connector to fetch all available GA4 properties associated with the account.
GA4 API quota and limits
Google Analytics Data API enforces token-based quotas per property. Each API request consumes tokens based on the query's complexity. For more information, refer to Data API limits and quotas topic.
The following quotas apply per GA4 property:
| Quota Type | Standard GA4 | Analytics 360 |
|---|---|---|
| Daily Tokens | 200,000 | 2,000,000 |
| Hourly Tokens | 40,000 | 400,000 |
| Concurrent Requests | 10 | 50 |
Each API request consumes 10–50 tokens, depending on:
- Number of metrics requested.
- Number of dimensions included.
- Query complexity.
- Pagination for large datasets.
Factors affecting execution time
The execution time of a Data Flow depends on several factors:
- A 20-second pause between API calls to avoid rate limits.
- Number of GA4 properties selected.
- Date range of the query (longer ranges mean more API calls per property).
- Number of metrics and dimensions.
- Pagination required for large datasets. Large datasets may require multiple calls per property.
When you select many properties or long date ranges, the Data Flow may take longer to complete.
Property limits and execution
For optimal performance, consider the following guidelines:
| Number of Properties | Estimated Execution Time | Recommendation |
|---|---|---|
| 1–50 | ~17 minutes | Recommended |
| 51–100 | ~35 minutes | Acceptable |
| 101–500 | ~2–3 hours | Consider splitting |
| 500+ | 3+ hours | Split into multiple runs |
Google's API has a limit of 40,000 tokens per property per hour for Standard GA4 accounts.
Best practices
- Limit runs to up to 100 GA4 properties per Data Flow when possible.
- If your account contains many properties, divide them across multiple Data Flows.
- Use shorter date ranges to reduce the number of API calls.
- Avoid highly complex queries with many metrics and dimensions when working with large property sets.
Select predefined reports
Data Integration provides a convenient entry point and recommended approach for accessing a range of predefined reports. Each report includes a concise data description, a list of customizable fields (if applicable), and the schema mapping.
These reports follow a standardized format so you can access specific fields only through Custom Reports.
Select custom reports
Google Analytics 4 (GA4) provides advanced tracking and analysis capabilities to help businesses gain valuable insights into user behavior and website performance.
In GA4, there are two main report types:
- Cohort Report
- Standard Report
To learn more about the Google Analytics Data API, refer to the Google Analytics Data API.
GA4 cohort report
The Cohort Report helps you analyze user behavior within specific user groups during a designated time frame. A cohort is a group of users who share a characteristic or experience within a defined period. The Cohort Report provides valuable insights into the long-term behavior of these user groups, letting you monitor user acquisition daily, weekly, or monthly.
GA4 standard report
The Standard Report in GA4 provides pre-configured insights into aspects of your website or app performance. This report covers audience, acquisition, behavior, and conversions, letting you understand user behavior, traffic sources, popular content, and conversion rates.
Select time period
This report lets you extract the data by selecting a time period.
- Start Date is mandatory.
- You can retrieve data for the date range between the Start and End dates.
- If you leave the End Date blank, Data Integration pulls the data at the current time of the Data Flow's run.
- Dates timezone: UTC time.
- The Start Date does not advance if a Data Flow run is unsuccessful. If you do not want this default setting, click More Options and turn on the Update incremental date range also on failures checkbox to advance the start date even if the Data Flow run is unsuccessful (not recommended).
- Use the Last Days Back For Each Run option to gather data from a specified number of days before the selected start date.
Time chunk size
This feature lets you partition your data into intervals, which is beneficial when working with large data volumes. Data Integration divides the data based on the specified interval size, letting you make manageable data calls.
Select dimension and metrics
GA4 provides businesses with insights into user behavior and website performance. Dimensions represent user attributes, while metrics offer quantitative measurements. Together, they help analyze data, gain audience insights, and optimize marketing strategies. By segmenting data and tracking performance, businesses can make informed decisions to achieve their goals.
Dimensions
Dimensions in GA4 represent characteristics or scopes of events, users, or items. They provide descriptive information that helps segment and categorize data. GA4 includes predefined dimensions such as user ID, device type, country, and traffic source, which offer valuable insights into user behavior and demographics.
Select Metrics
Metrics in GA4 represent measurable data points that quantify user interactions, conversions, and key performance indicators. GA4 provides a wide range of predefined metrics such as pageviews, sessions, bounce rate, and average session duration, giving a comprehensive view of website or app performance.
- You can choose up to 9 Dimensions and 10 Metrics.
- Explore Dimension or Metric descriptions using the GA4 Dimensions & Metrics Explorer for reviewing purposes.
Advanced options
The Custom Dimensions and Metrics feature is available in the Advanced Options section. Custom dimensions and metrics are elements you create to examine data tailored to your business needs. You can use them when establishing custom event parameters or user properties.
Creating custom dimensions
Prerequisite
To create custom dimensions and metrics, you must have Editor or Administrator role.
-
Click the Admin within Google Analytics.
-
Access the Custom Definitions section within the Property column.
-
In the Custom dimensions tab, click Create custom dimensions.
-
Provide the following details:
a. Name of the dimension: Enter a distinct name for the dimension. Do not use hyphens; use underscores and spaces instead.
b. Scope: Select a scope for the dimension.
c. Description: Provide a description for the dimension.
d. Event parameter/User property: Choose the data source. -
Click Save.
During the initial 48 hours, your custom dimension will have a value of (not set) assigned to it.
Creating custom metrics
-
Click the Admin within Google Analytics.
-
Access the Custom Definitions section within the Property column.
-
In the Custom metrics tab, click Create custom metrics.
-
Provide the following details:
a. Name of the metric: Enter a distinct name for the metric. Do not use hyphens; use underscores and spaces instead.
b. Scope: Ensure you create a metric scoped to an event.
c. Description: Enter a memorable description for the custom metric.
d. Event parameter: Select the data source for the metric.
e. Unit of measurement: Choose the appropriate unit of measurement. -
Click Save.
During the initial 48 hours, your custom dimension will have a value of (not set) assigned to it.
For additional details about Scopes, Units of measurement, and the Source of data, refer to the Google Analytics - About custom dimensions and metrics topic.
Sub Data Flows in GA4
Google Analytics 4 introduces a set of Sub Data Flows fields. These fields let you delve deeper into the analytics data and gain specific insights from your website or app performance:
- Account IDs
- Source Connection
- Account Properties
- Time Period
- Target Connection
- Database Name
- Schema
Optimizing loading errors through expression casting
If you use Snowflake or BigQuery as your target, you might encounter the following error if the expressions are not correct:
Loading failed: Merge into DB.SCHEMA.GA_sessions failed. Error - ('22007', "[22007] can not parse '0' as date with format 'YYYYMMDD' (100097) (SQLExecDirectW)")
To prevent this error, apply the recommended expression as indicated below:
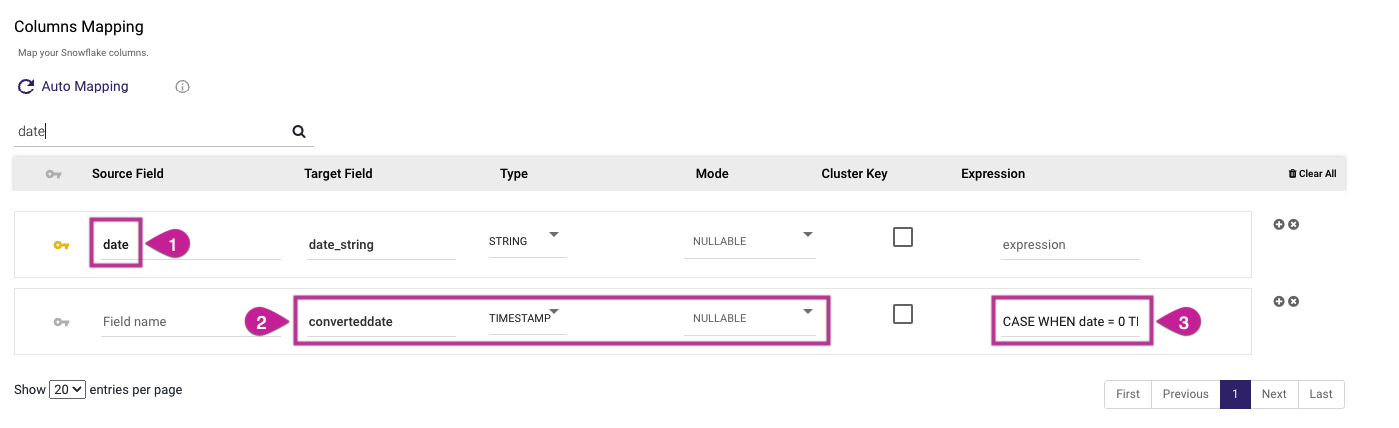
When using Snowflake as the Target, use the following expression:
CASE WHEN date = 0 THEN '1900-01-01'::DATE ELSE TO_DATE(CAST(date AS VARCHAR), 'YYYYMMDD')::DATE END
When using BigQuery as your Target, use the following expression:
SAFE.PARSE_DATETIME("%Y%m%d", CAST(date AS STRING))
Google Analytics 4 API filtering limitations
Google Analytics prioritizes user privacy. If your query involves restricted data (such as demographics), recent time frames, or intricate filters, you might view a decrease in results.
In the event of a noticeable decline, consider extending your time frame, streamlining filters, or promoting the opt-in for Google Signals to access more comprehensive data.
Prevent data loss in Google Analytics and its API:
-
Reduce number of filters:
- Minimize the number of filters for essential analysis.
- Avoid non-crucial filters.
-
Merge filters: Combine multiple filters for efficiency.
-
Widen filter criteria: To capture a broader data range, make filter conditions less specific. For instance, filter for a category rather than a specific page.
-
Remove unnecessary dimensions: Remove dimensions that are not directly relevant to your analysis.
-
Explore alternative dimensions: Consider using alternative dimensions for similar insights with less complexity. For example, filter by region instead of city.
-
Consistency in dimension and metric usage: Ensure that you employ identical Dimensions and Metrics in both Data Integration and Google Analytics.
-
Adjust time frames: Expand the query time frame to access more data, particularly with less common dimensions or filters.
