Universal Analytics walkthrough
Currently supported:
- Reporting API - Version 3
- Management API - Version 4
Prerequisite
A valid Google Analytics connection in Data Integration.
Pulling data from Universal Analytics in Data Integration
The data extracted from the Google Analytics connector uses a configuration of metrics and dimensions.
You can organize the data into views (profiles), properties, and accounts. Views are related to Properties, and Properties are related to accounts.
Data Integration lets you pull data from multiple views by selecting specific views or selecting any property/properties or account(s), as data of related views are extracted.
- Choose the report type. There are six report types.
-
Select the Google analytics connection or create a new connection. Click Test connection to make sure the connection is valid.
-
Select the view to pull the data:
- Leave the inputs of accounts, properties, and views empty to pull data for all available views in the given Google Analytics connection.
- Click any accounts, properties, and views inputs to get lists of all available accounts, properties, and views. Once the lists are populated, you can search for the required values.
- Any selection of an account filters the values in the lower levels (properties and views) to include only items that belong to the selected account.
-
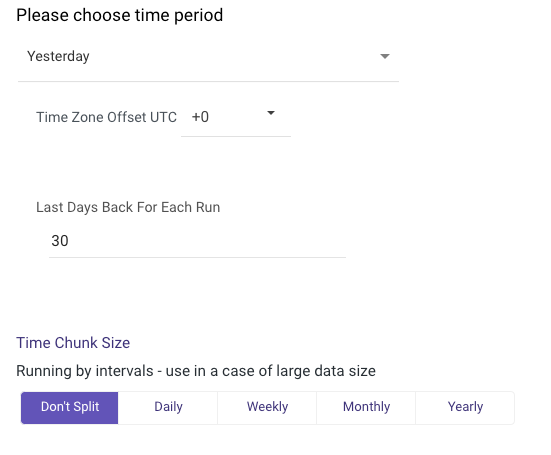
Time period:
a. Select the type of time period for the report. It can be a custom date range or a defined time period (for example, Yesterday, last week, etc.).
-
Select the start date and end date.
-
Leave the end date empty to pull data until the river runs.
-
After each run of the river, the start date will be updated automatically with the end date, and the system updates the end date with an empty value. This enables the next run to pull data from the end of the previous run.
-
Select the time zone offset. It is relevant only if the end date is empty to find the river’s run based on the time zone.
-
Last Days back: Use this to pull data from a given number of days before the start date.
b. Selecting any other value:
- Select the timezone offset to send the correct dates that consider that offset.
-
-
Select the dimensions and metrics of the report.
- Click on each input to view the available fields.
Specific combinations of Dimensions and Metrics are permitted by Google Analytics. You will receive an error message if the selected combination is not permitted.
- XX metrics are custom metrics defined in Google Analytics.
- You need to manually insert the required metrics by clicking on the metrics field and writing the metric in lowercase.
- Insert each metric by clicking the Enter.
- For example, goal2completions
- Make sure to insert metrics defined in your Google Analytics account.
In some cases, Audience dimensions like userGender and userAgeBracket can reduce the number of entries and total sessions (only rows that contain these dimension(s) will return) due to Google Analytics user privacy policy and limitations.
- Segment: Click to get a list of all available segments in the Google Analytics account. After choosing at least one segment and an additional field, segments are available in the mapping, which defines each record set broken down by segment. For example, the table shows each record received for a given segment. In this use case, the set of New Users is part of the set of All Users.
| date | segment | sessions | totalEvents |
|---|---|---|---|
| 20210710 | All Users | 1478 | 33313 |
| 20210710 | New Users | 161 | 3726 |
-
Additional fields: The platform adds any selected fields in that list to the results as extra fields. Use this when you need account, property, or view details in each record.
-
Advanced options:
a. Custom metrics: View a list of all available custom metrics of the given Google Analytics connection.
b. Custom dimensions: You can view a list of all available custom dimensions for the given Google Analytics connection.
importantIf you select more than one view, the custom dimensions/metrics you select must support all the selected views; otherwise, an error occurs.
c. Sort: Choose how to sort the results by any selected dimension.
d. Filters: Choose how to filter the data.
Follow syntax instructions when filtering data:* == Equal
* != Does not equal
* > Greater than
* < Less than
* >= Greater than or equal to
* <= Less than or equal to
* == Exact match
* != Does not match
* =@ Contains substring
* !@ Does not contain a substring
* =~ Contains a match for the regular expression
* !~ Does not match a regular expression
Troubleshooting
- When analyzing your metrics, some metrics are unique and cannot be combined with different dimensions without knowing what happens.
If you view a range of time intervals in Google Analytics' UI, for example, 31 days back, to get the same values for users and other unique fields, you must set the same parameters in your River, except not selecting the date dimension, as it splits your data by daily intervals. Choose a time chunk size that will not be split.
Retrieving the number of users from each dimension may result in overestimating the number of real users who viewed your website. To learn more, refer to the link.
- If your request to the Reporting API fails due to a server error, the response code 500 or 503 is returned.
You can resubmit the request, but do not resubmit it more than once if it fails repeatedly.
Google Analytics permits:
- 10 failed server requests per project per view (profile) per hour
- 50 failed server requests per project per view (profile) per day
You use three requests per run when running the river. If the number of failed requests exceeds the above limits, you will receive the 429 error:
The number of recent reporting API requests that failed due to a server error (500 or 503) is excessive. You will be unable to access the reporting API for at least an hour. To avoid getting blocked in the future, send fewer server errors.
Limit the date range, number of dimensions in the request, or number of metrics in the request to reduce the request server error.
