Facebook Social walkthrough
Currently supported API versions:
- Marketing API version 21
- Graph API version 21
You can configure and use the Facebook Social API integration within Data Integration. Data Integration supports Facebook reports that let you pull data from Facebook pages, including private and public pages, and specific insights related to posts, videos, and feeds.
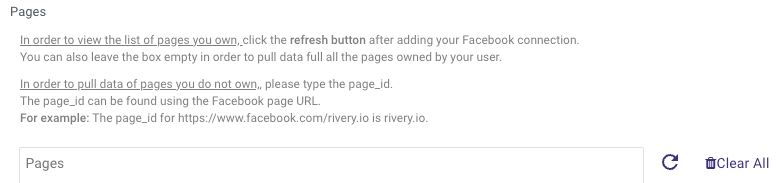
Pages
Each Facebook report links to one or more Facebook pages.
Viewing Facebook pages
To view the list of Facebook pages you own, click refresh after adding your Facebook connection.
You can leave the page selection empty if you want to pull data from all the pages your user owns.
Pulling data from non-owned pages
To pull data from Facebook pages that you do not own, you must manually add the relevant page_id.
- The
page_idis available using the Facebook page URL.
Example: The page_id for https://www.facebook.com/rivery.io isrivery.io.
After selecting the appropriate page(s), you can pull data for the selected pages.
Page fields
You can only pull data from the fields available in Facebook's public pages, excluding private fields such as Best_page, Access_token, and others.
Facebook Social reports
Data Integration supports four types of Facebook reports:
- Feed Report
- Returns data about the selected Facebook page feeds (Likes, Comments, Shares).
You can pull data from public Facebook pages or private pages that your Facebook account owns.
The public page data may have fewer fields due to Facebook privacy settings.
Also, Facebook limits data pulls to 200 calls per hour for pages you do not own. Exceeding this limit results in errors.
-
Insights - Page
- Returns data on Facebook page insight metrics such as Impressions, Clicks, and more.
- You can only pull data from private pages your Facebook account owns.
- The metrics include reactions from other pages that shared a post, so the numbers can be higher than displayed in the UI. Use the Feed Report for UI-specific metrics.
-
Insights - Post
- Returns data on the posts of the selected Facebook page(s) such as Impressions, Clicks, and more.
-
Insights - Video
- Returns video insights for selected Facebook pages, including Impressions, Clicks, and more.
- Facebook aggregates video insights across pages. If you post a video on multiple pages, the insights reflect the sum of all those pages.
Feed report
To pull data for the feed report:
- Select Metadata fields
- Choose the metadata fields you want to include for each reporting level (Feed, Comments, Reactions).
- Leave the input box empty to pull all available fields.
-
Tagging or Hidden Posts
Check the relevant boxes to include data on tagged or hidden posts at the bottom of the page.
The feed report will automatically include the total number of comments and reactions by type (For example, happy, sad, or like) within the selected date range.
Insights reports
For insights reports:
-
Select Pages
Choose the pages for which you want to retrieve insights. -
Select Metadata Fields
Choose metadata fields relevant to the report level. For example, fields are specific to individual posts for post insights. -
Select Metrics
Choose the metrics you want to measure (For example, Impressions, Views). -
Select Metrics Period
Define the period for which Data Integration calculates metrics (For example, Daily, Weekly). -
Additional Data
Some reports offer additional data via checkboxes. For example, in the Insights - Posts report, you can include data from Promotable (dark) posts with regular posts.
Metrics for each report:
- Metrics starting with
page_*are for the Page Insights Report. - Metrics starting with
post_*are for the Post Insights Report. - Metrics starting with
post_video_*are for the Video Insights Report.
Post Fields Restrictions:
To extract post fields for a live video that has ended, you must have an Admin role on the post's page.
Fields that require an admin role for access include: description, name, object_id, source, and type.
Metrics
Select the metrics relevant to your insights reports. Common metrics include:
- Impressions
- Views
- Clicks
Metrics period resolution
The Metrics Period Resolution defines the time frame for calculating your metrics.
For instance, selecting Daily for the Impressions metric returns daily results for the selected date range.
Some metrics may not work with the chosen Metrics Period Resolution. To learn more, refer to the Facebook - Page Insights topic.
Time period
You can choose the report time period for all Facebook Social Reports. You can select:
- A custom date range (from a specific start to end date).
- A predefined time period (Yesterday, Last Week, and so on).

Procedure
- Select the start and end date for the report.
- Leave the end date empty to pull data until the Data Flow runs.
- Data Integration automatically updates the start date with each run.
- Choose the time zone offset to adjust the date to your local time zone if the end date is empty.
- Use Days back to specify how many days before the start date to pull data.
Data Integration does not update the start date if a Data Flow run is unsuccessful unless you choose to advance it even on failure (not recommended).
Ignore errors for Accounts
You can enable the option to ignore errors for accounts. If an issue arises while generating a report for one or more accounts, the Data Flow will continue running without failure.
Facebook graph API rate limitation
The Facebook Graph API enforces rate limits to ensure fair usage across all users and applications. These rate limits differ depending on the access token type you use, which can be at the user or application level.
User-level rate limits
Facebook assigns each user a specific rate limit for API calls, calculating it over a rolling one-hour window. If a user exceeds the allotted number of requests, Facebook blocks further requests until the usage drops below the threshold. This ensures that users do not overwhelm the system and that Facebook distributes resources among all users.
Application-level rate limits
Facebook bases the rate limit for applications on the number of active users, calculating it as 200 requests per user per rolling hour, shared among all users. All users’ total number of requests contributes to the application’s rate limit.
It is essential for applications to monitor and manage API calls to prevent hitting the application-wide limit.
Monitoring rate limits
You can track the current status of your rate limits using response headers in the API calls. One useful header is X-App-Usage, which provides real-time data on the percentage of the limit used. Monitoring these headers helps you stay aware of your API usage and adjust your request pacing accordingly.
Best practices to avoid rate-limiting disruptions
To avoid disruptions due to rate limiting, consider implementing the following best practices:
- Manage request pacing: Distribute your API requests over time to ensure that they do not accumulate too quickly and exceed the rate limits.
- Handle rate-limit responses: Set up your application to detect and handle rate-limit responses (such as HTTP status code 429), so it can retry the request once the limit window resets.
- Use request queuing or throttling: Implement queuing or throttling mechanisms to control the rate at which your application sends API requests, ensuring they stay within the allowable limits.
Impact on Data Integration Data Flow runs
Rate limits can also impact the duration of Data Flow runs in Data Integration. If the API requests exceed the rate limit, the process may pause until the next rate limit window is available. This pause can extend the time for a Data Flow run to complete. To minimize this impact, optimize API calls and follow the best practices.
