Connector usage dashboard
The connector usage dashboard gives administrators visibility into how AI agents and MCP clients use MCP connectors configured in Boomi Connect. It shows which connectors and actions receive the most tool calls and which users account for the most calls over a selected date range.
Each time an AI tool calls an MCP connector action, that activity is logged. Examples of tool activity include an AI assistant adding a contact in Salesforce or pulling a report from NetSuite.
Click Dashboard on the left navigation menu to access the dashboard.
What you can monitor
Use the dashboard to monitor real-time and historical MCP tool call activity, identify usage patterns, and investigate activity by connector, user, or action.
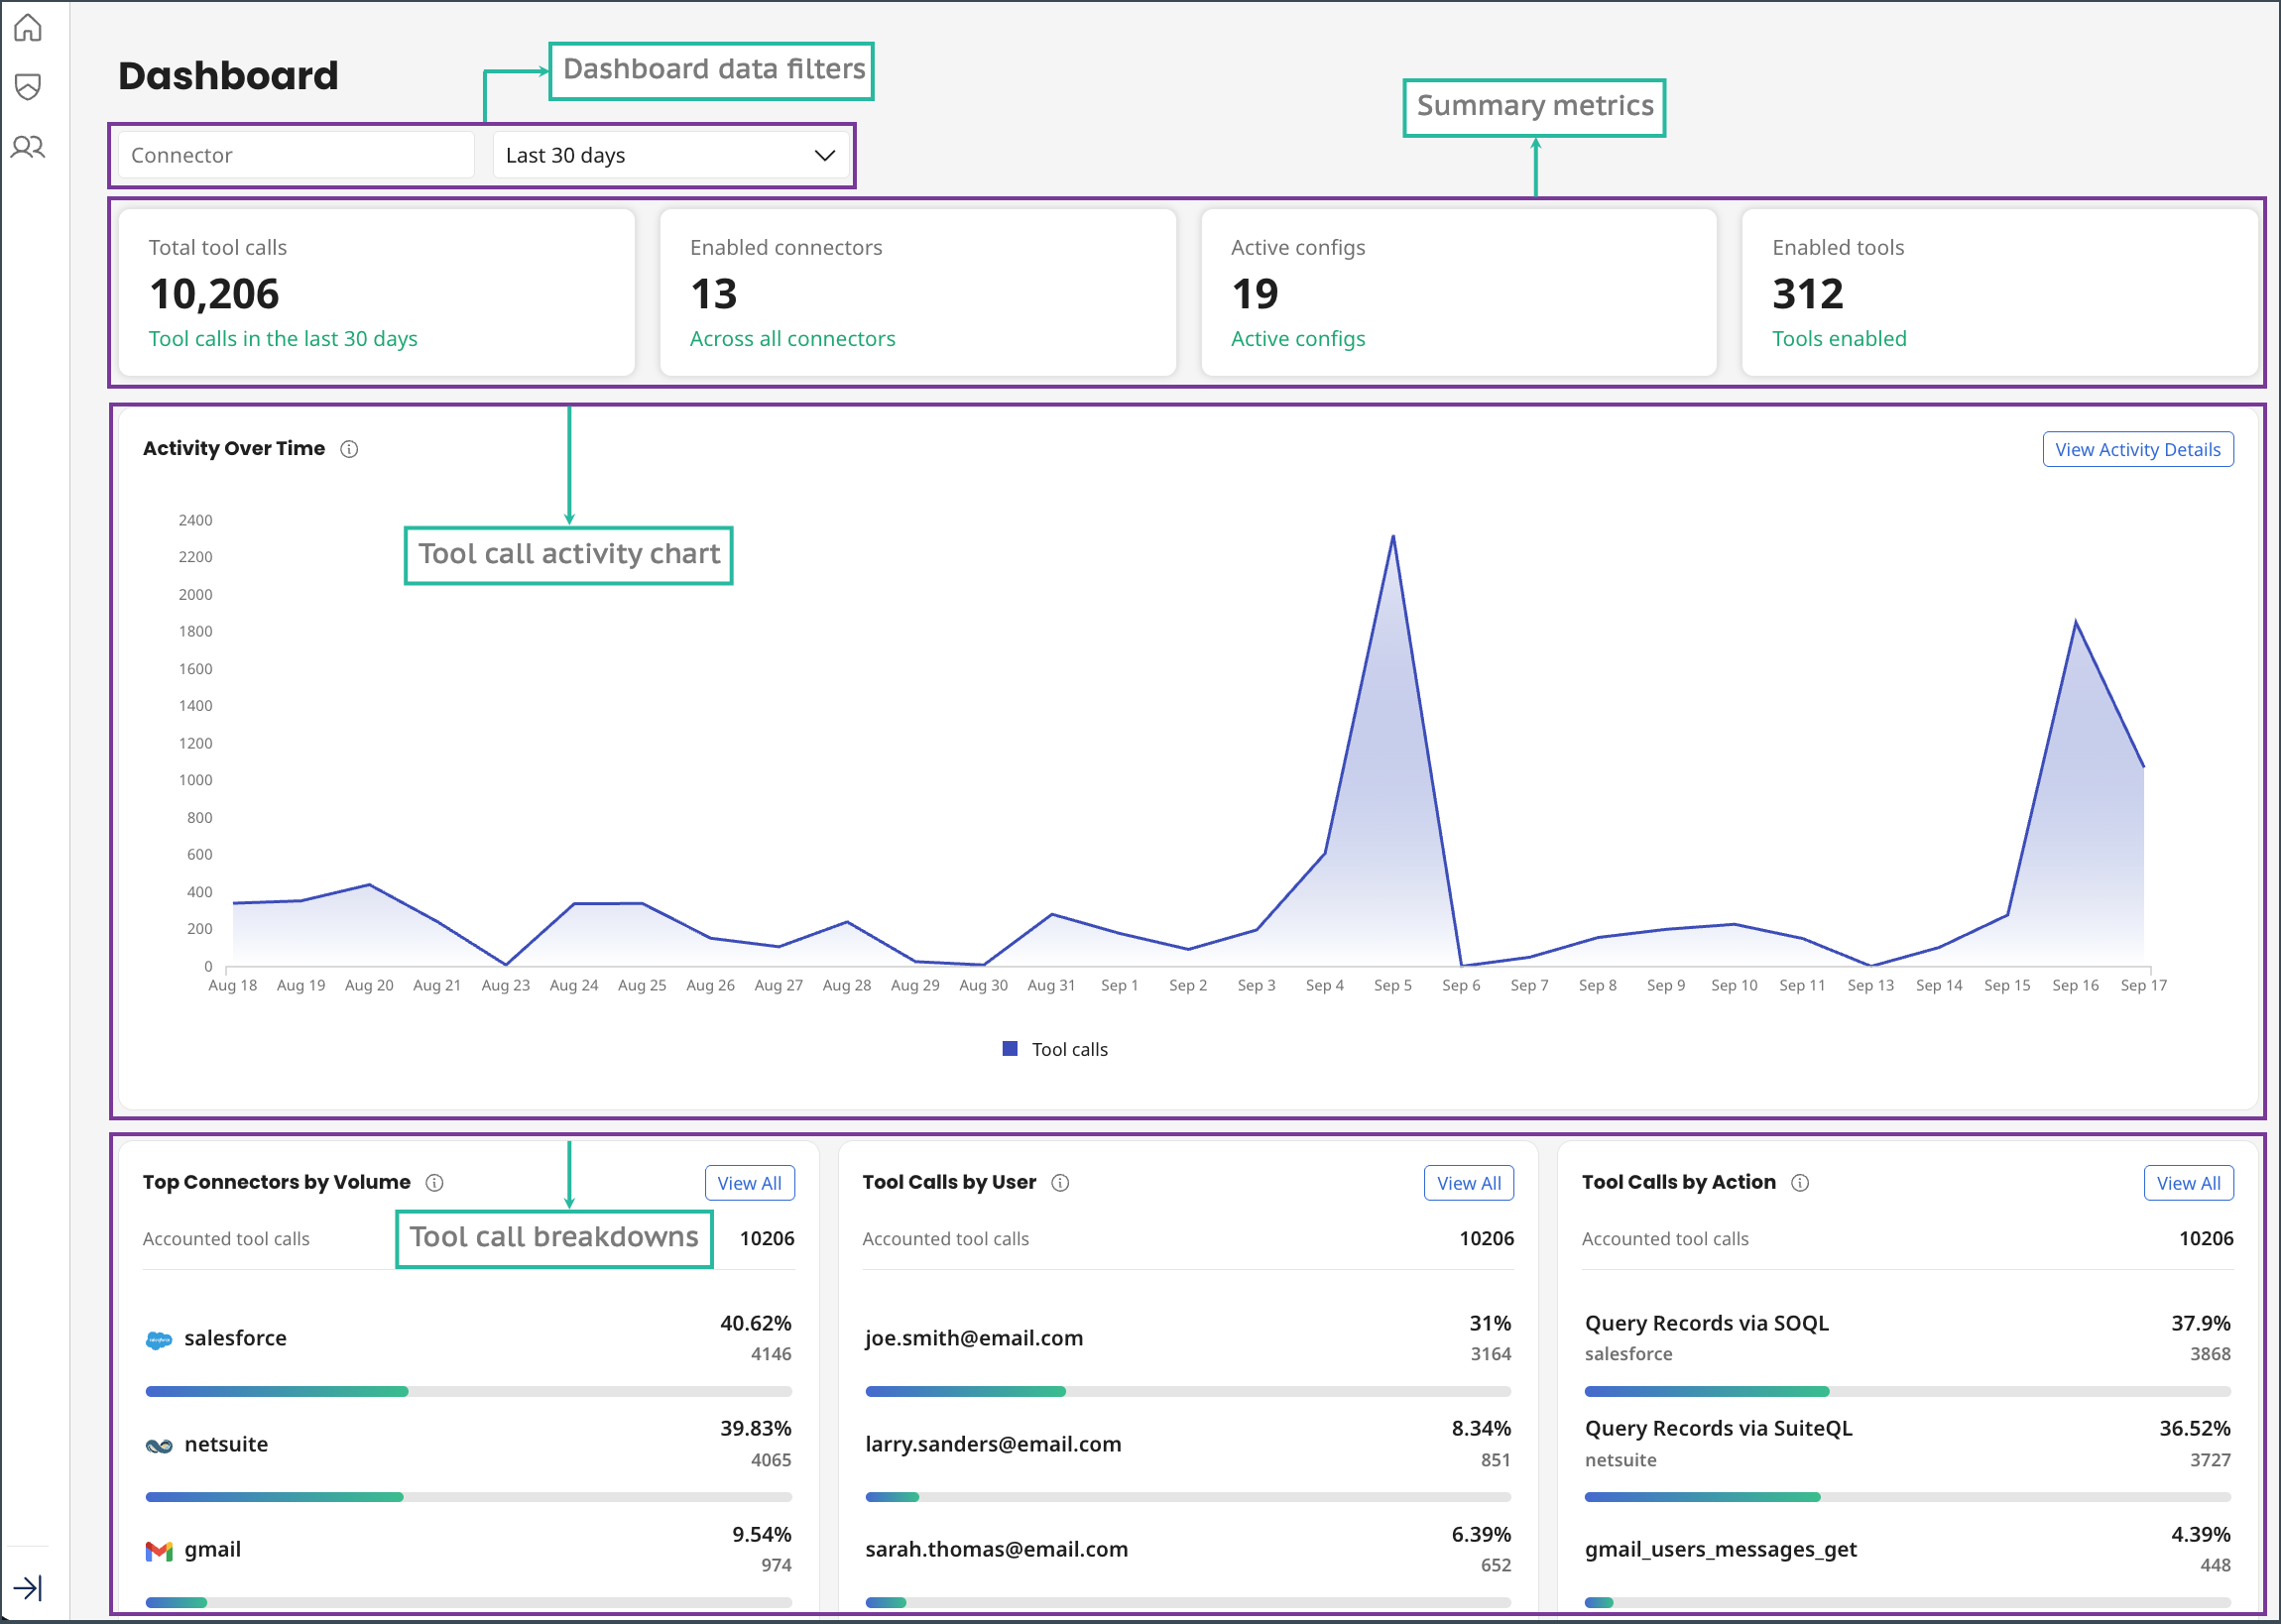
The dashboard includes summary metrics, a tool call activity chart, and tool call breakdowns by connector, user, and action. The dashboard also includes filters for narrowing for the displayed data.
Summary metrics
The summary metrics includes the following tiles that provide an account-level summary of connector and tool activity.
- Total tool calls: The number of requests made to the connectors.
- Enabled connectors: The number of connectors that have at least one configuration.
- Active configs: The number of individual connector configurations.
- Enabled tools: The number of individual tools enabled across all connectors.
Tool call activity chart
The Activity Over Time chart shows tool call volume and changes in tool call activity over the selected date range. Point to the chart to view additional information in a tooltip.
To view additional activity information, click View Activity Details. On the Activity Details side panel that opens, you can:
- Select a date range.
- View activity by Connectors, Users, or Actions.
- Review tool call counts and percentages for the selected view.
You can use the date range and activity view together to narrow the displayed details.
Tool call breakdowns
The dashboard includes the following tool call breakdowns:
- Top Connectors by Volume: Shows connectors ranked by tool call volume. For each connector, this breakdown displays its tool call count and percentage of accounted tool calls.
- Tool Calls by User: Shows tool call activity by user. Users are identified by the email address associated with the account's IdP. For each user, this breakdown displays the tool call count and percentage.
- Tool Calls by Action: Shows activity for individual connector actions. For each action, this breakdown displays the tool call count and percentage.
To view additional results for a specific tool call breakdown, click View All for that breakdown. The results open in a side panel and are paginated, with each page showing 10 results.
Filtering dashboard data
Use one or both the filters at the top of the dashboard to narrow the displayed data. For example, you can view tool calls for a specific connector within a specific date range.
Connector filter
This filter lists connectors enabled for your account. Type a connector name to find it in the list, then select one or more connectors.
Date range filter
Use the date range filter to choose the period for which you want to view activity. You can view activity for today, last 7 days, 30 days, or 90 days.