Monitoring Dashboard
Overview
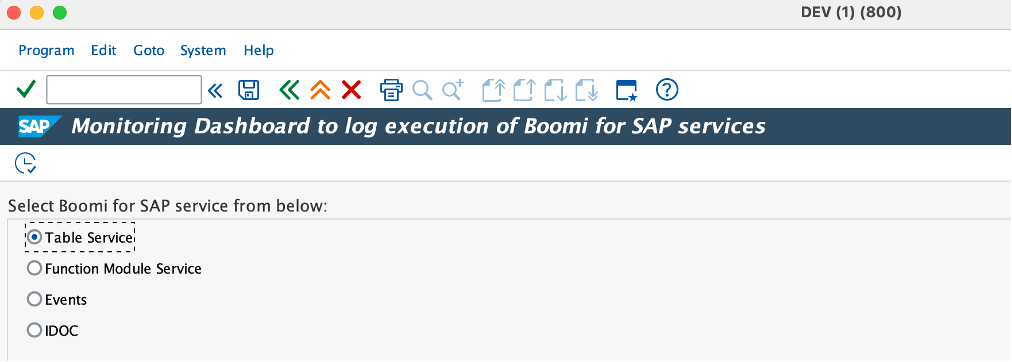
The monitoring dashboard gives you the ability to track the execution status of your services (Table Services, Function Module Services, Events, and IDocs). Other features include alerts for failures, custom views for specific metrics, and historical data analysis.
Once signed into the SAP GUI, execute transaction code /IXBX/ZBX021 or /IXBX/MON_DASHBOARD to navigate to the monitoring dashboard. Each service has its own selection screen where you can configure what events you'd like to subscribe to.
Configuring the Selection Screen
The screenshot below is from the Table Services selection screen. Each service has its own similar screen with criteria relevant to the service.
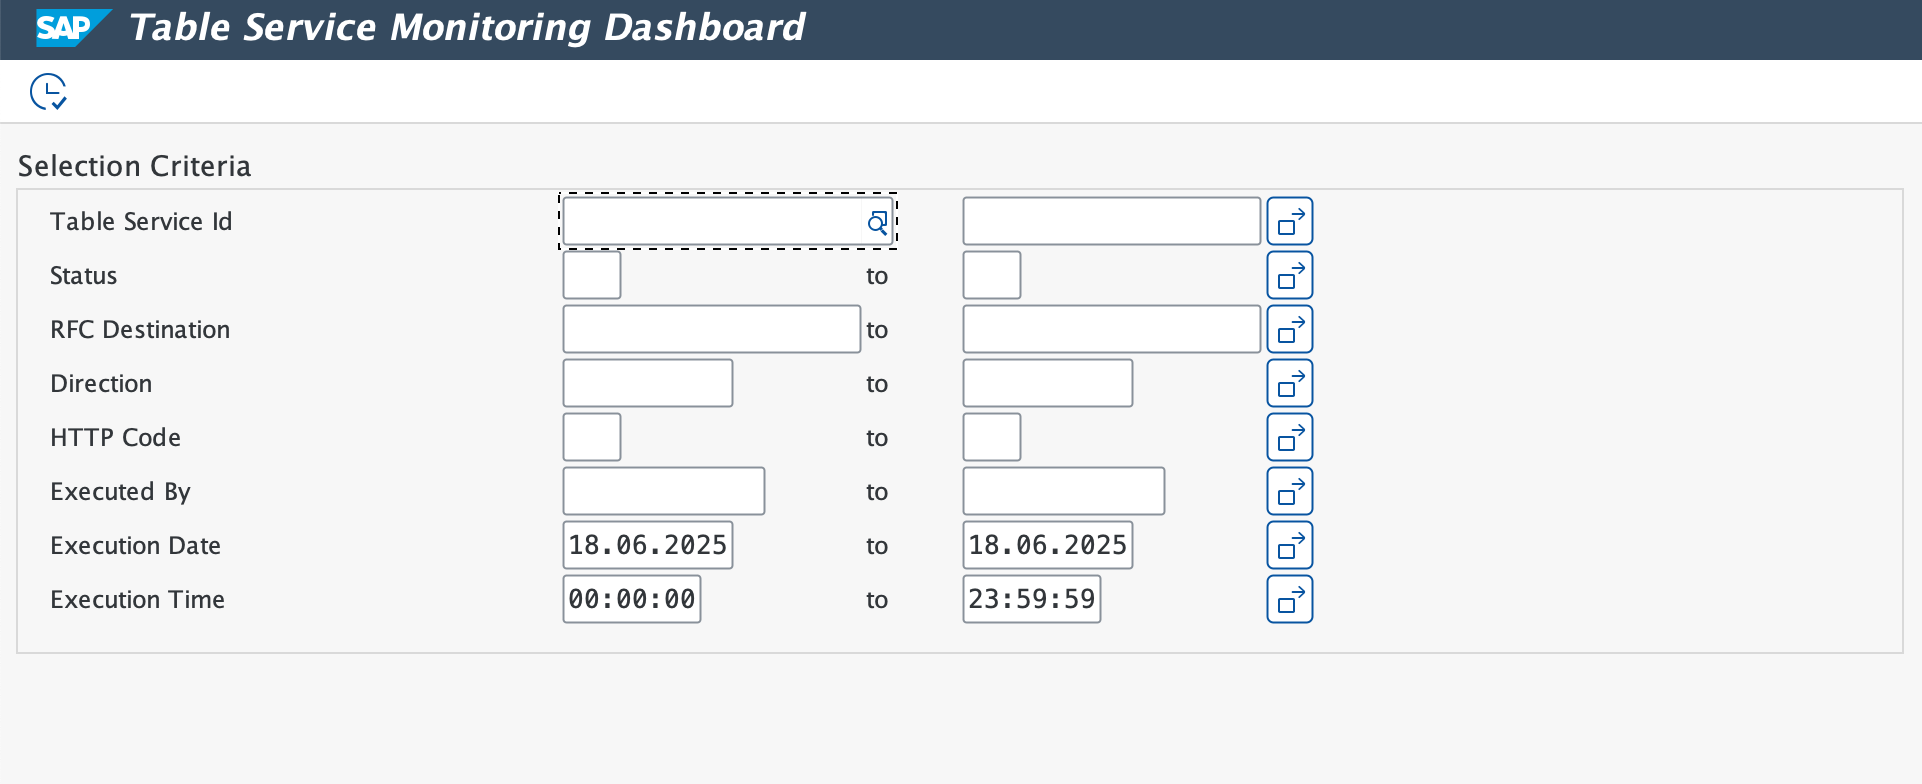
Once the desired criteria are selected and you click Execute, the relevant execution log records will be displayed in ALV grid format. For example, if you wanted fetch the executions that happened during a certain time period, you would configure the Execution Date and Execution Time fields accordingly and click Execute.
Fields with large amounts of associated data are hyperlinked with pop-ups so the data is easier to read. You can also export the data to your local system by navigating to List in the navigation bar, then Export > Spreadsheet or Local File.
