Dashboard
The Dashboard link in the API Management menu opens the API Dashboard page. The dashboard allows you to gain insights into API performance by tracking usage, viewing error rates, and assessing response times.
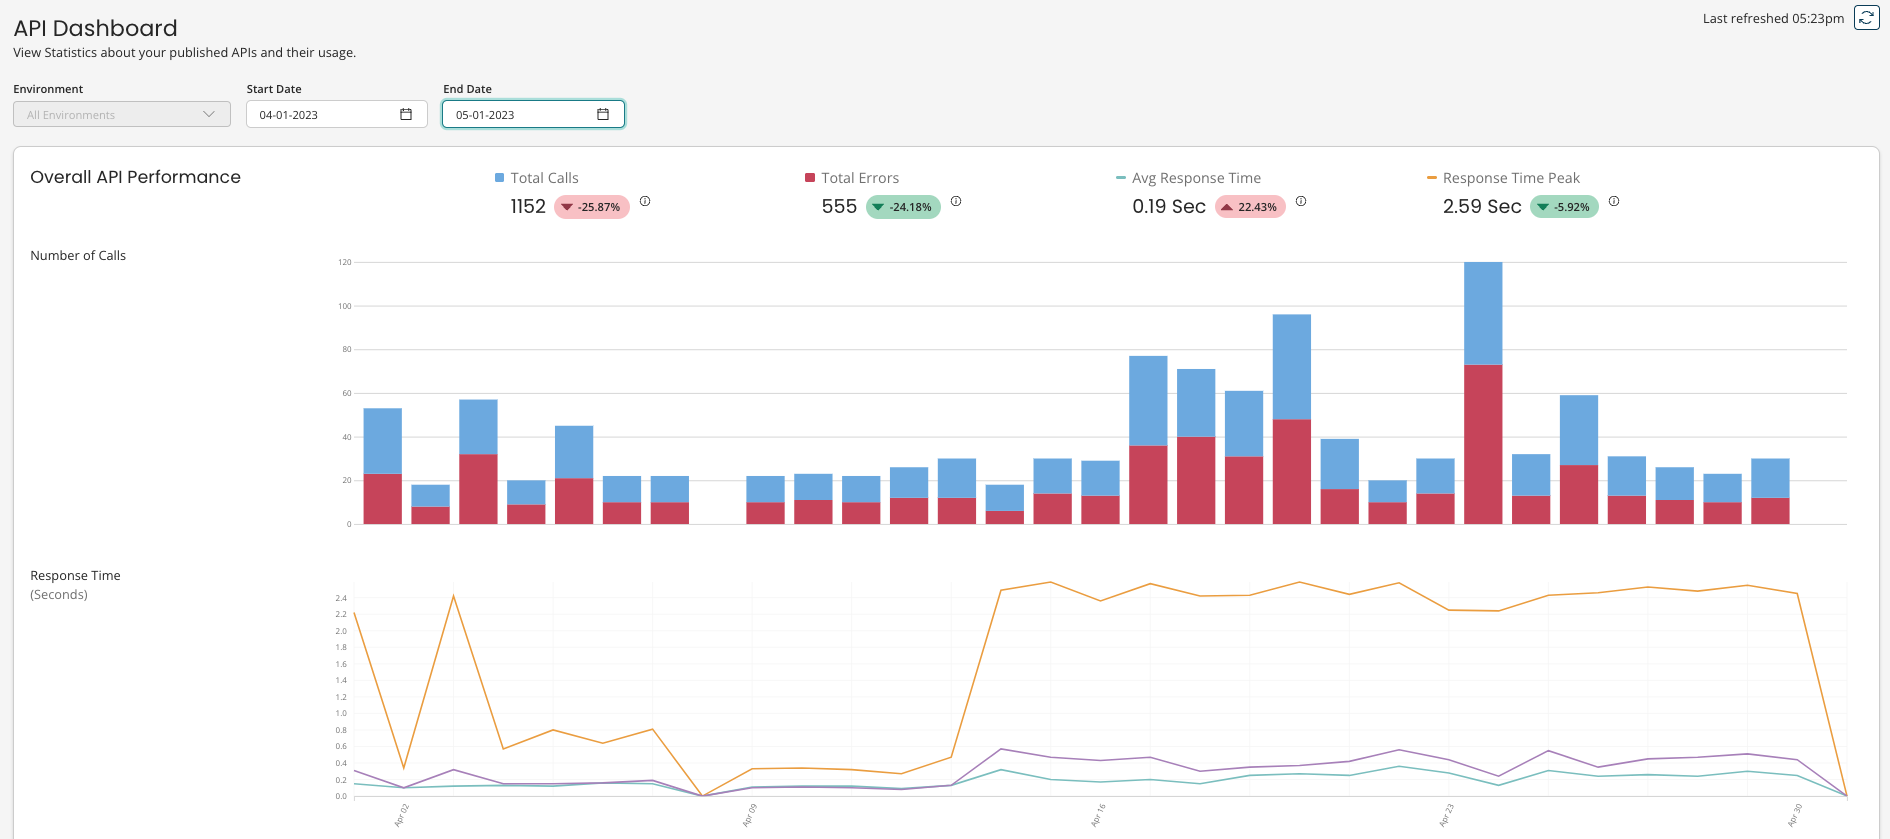
Overall API performance
The selected environment and date range determine the data in the graphs. You can view API statistics for all environments or for a specific environment. The default date range is the current date and you can also use the Select Date Range option.
If the current date is set for the start and end date, note that it displays data from 12am to the current time.
The dashboard presents total calls, total errors, average response time, and response time peak figures with a percentage that compares to the previous time period. If you are viewing seven days of data, the previous period would be the preceding seven days.
The dashboard's Environment filter only supports requests from 2023-05-01 onward. Refer to the Legacy dashboard for data before 2023-05-01.
The following information is available:
- Number of Calls - The number of successful calls (displayed in blue) and errors (displayed in red).
- Response Time - Average Response, Peak, and Standard Deviation in seconds.
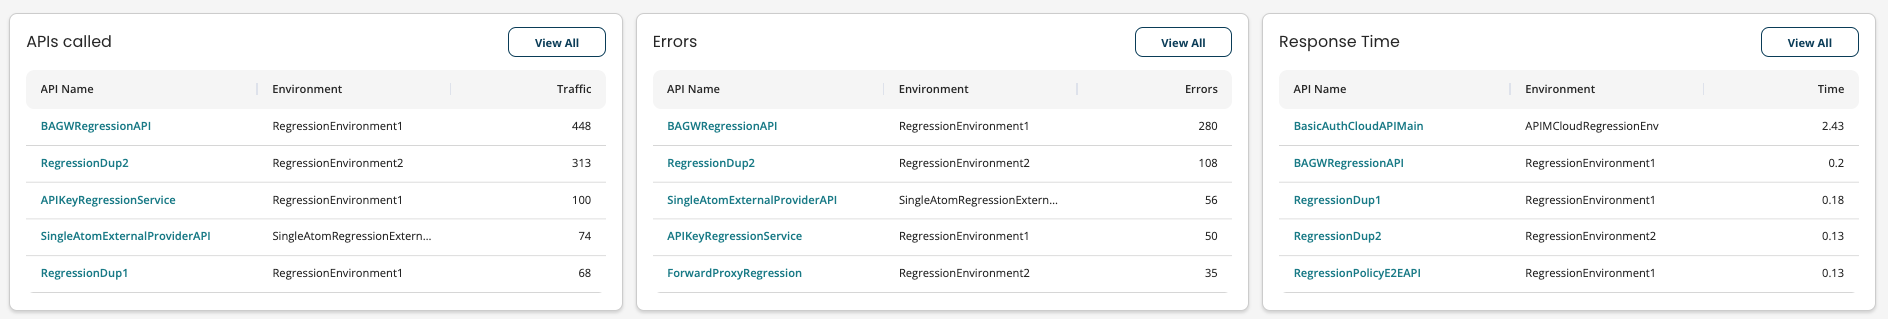
APIs called
The table displays the top five called APIs. You can also view all APIs and the statistics for each. Call Logs and Error Logs are available for each API.
- Call Logs and Error Logs provide the following statistics for each API call: Request Date, Gateway, Application Name, Request URL, HTTP Method, HTTP Status, and Response Duration. They also include Bytes Received, Bytes Sent, Quota Count, Quota Reset, Rate Reset, Remote Address, and Execution ID.
Errors
The table displays five APIs with the highest amount of errors. You can also view all APIs and the statistics for each.
Response time
The table displays five APIs with the longest response time. You can also view all APIs and the statistics for each.
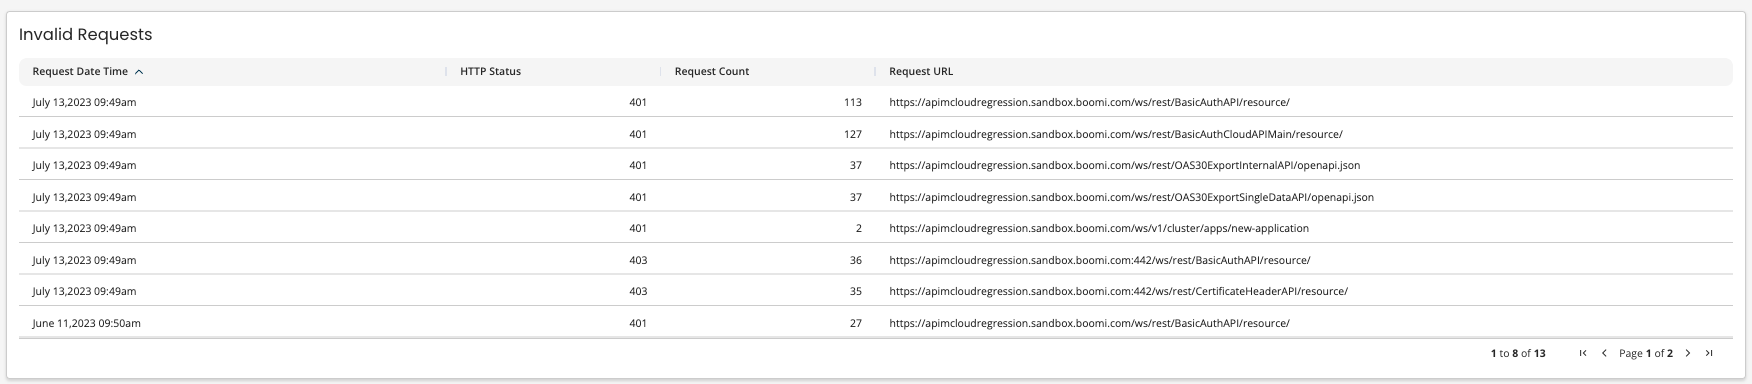
Invalid requests
The table displays the HTTP Status, Request Count, Request URL, and the Request Date Time for invalid requests.
