Understanding Telemetry data flow in API Gateway
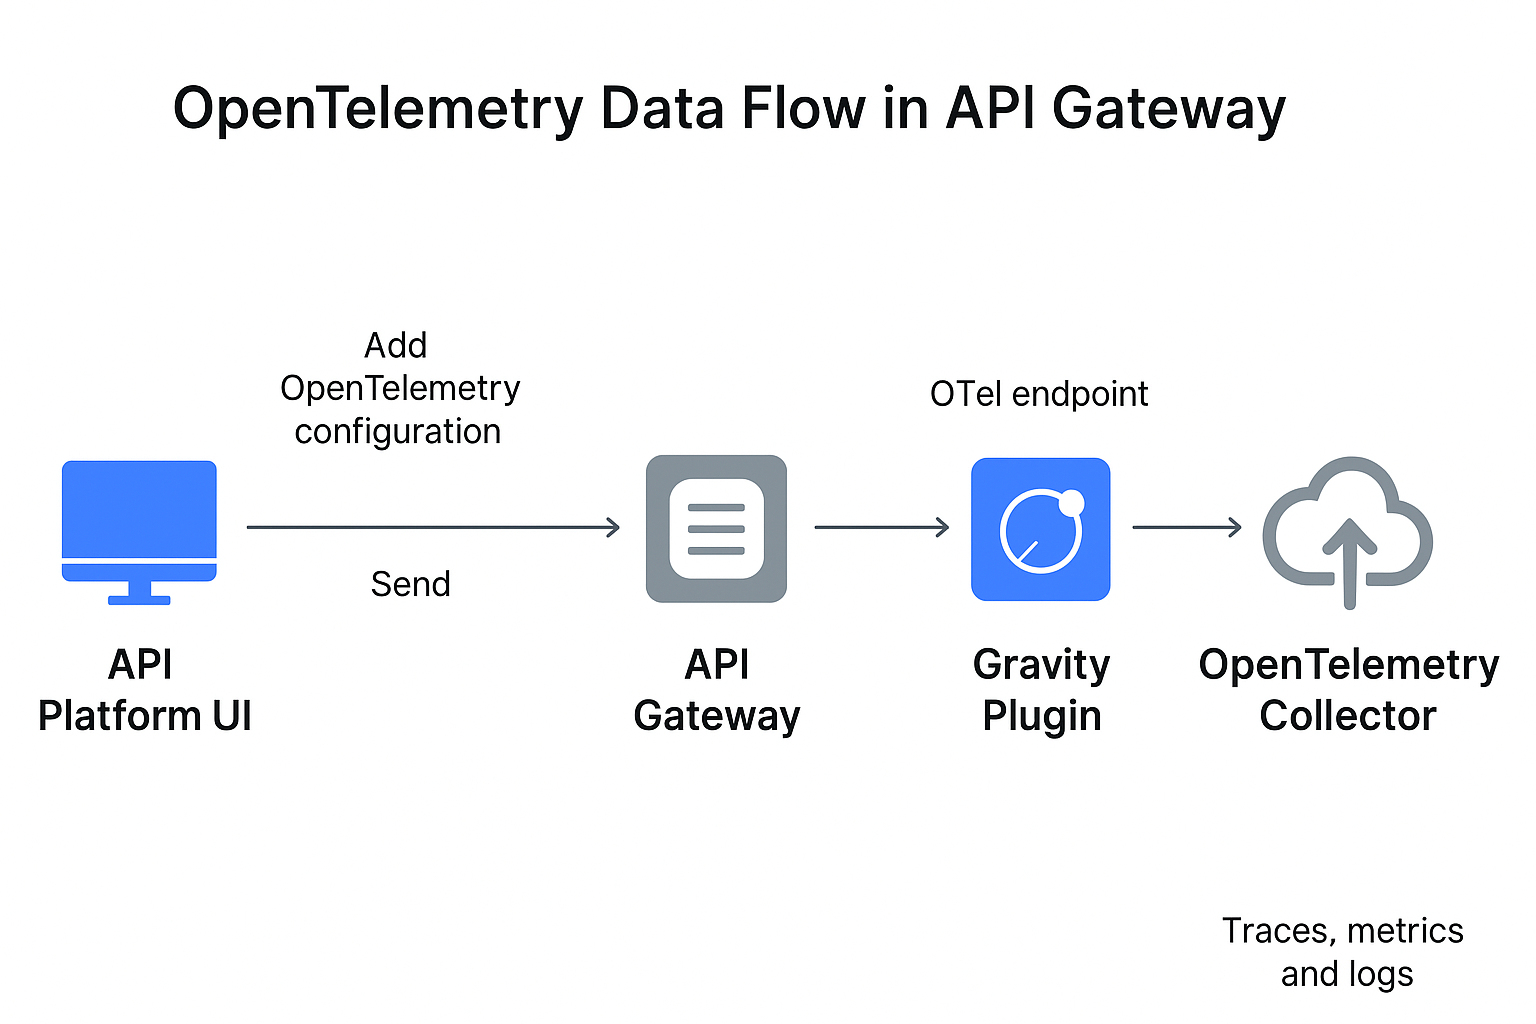
After configuring OpenTelemetry, the telemetry data (traces, metrics, logs) flows through several stages. The process below describes each stage in detail.
-
Configuration in Platform UI
Configure OpenTelemetry settings—such as endpoint URLs, data types (traces, logs, metrics), and authentication headers—from the Boomi Platform UI. When saved, the Platform sends the configuration to the backend service.
-
Message to Gateway
The Platform backend validates the entered values and generates a structured payload, typically in XML or JSON format. The system transmits this payload to the API Gateway via a GraphQL message. The Gateway then stores the payload in a config.xml file and automatically restarts to apply the new settings.
-
Gravity Plugin Activation
The Gravity plugin within the Gateway implements the OpenTelemetry tracer. Upon restart, the Gateway loads the updated config.xml, and the plugin reads the configuration parameters such as endpoint, authentication headers, and ports. Based on this, it initializes exporters for traces, metrics, and logs, establishes a persistent connection with the collector endpoint, and prepares export pipelines for runtime telemetry.
-
Data Capture at Runtime
The Gateway automatically generates telemetry when API requests flow through it.
traces, each request creates a trace, with spans added for operations such as request receipt, policy execution, forwarding, and response handling. The system propagates the trace context to track distributed requests across systems.
For logs, the Gateway and its plugins generate events that capture request errors, execution states, or policy failures.
For metrics, JVM statistics such as memory usage, CPU load, garbage collection, and performance counters are collected and aggregated at regular intervals.
-
Export to Collector
Telemetry data is serialized in OTLP format and exported from the Gateway to the configured collector using the Gravity plugin.
Export behavior by type:
- Traces – exported in near real-time.
- Metrics – exported every 60 seconds.
- Logs – batched and exported approximately every 60 seconds.
If compression is enabled, telemetry data is compressed (For example, using Gzip) before being transmitted over the selected protocol—gRPC, HTTP, or HTTPS.
-
Collector Processing
The collector serves as an intermediary between the Gateway and the target observability backends. It receives incoming OTLP telemetry on the configured ports (4317 or 4318), parses and validates the payload, and can optionally transform the data.
Transformations may include filtering or sampling traces, enriching telemetry with additional attributes, or converting formats to match backend requirements. Once processed, the collector forwards the telemetry to backends such as New Relic.
-
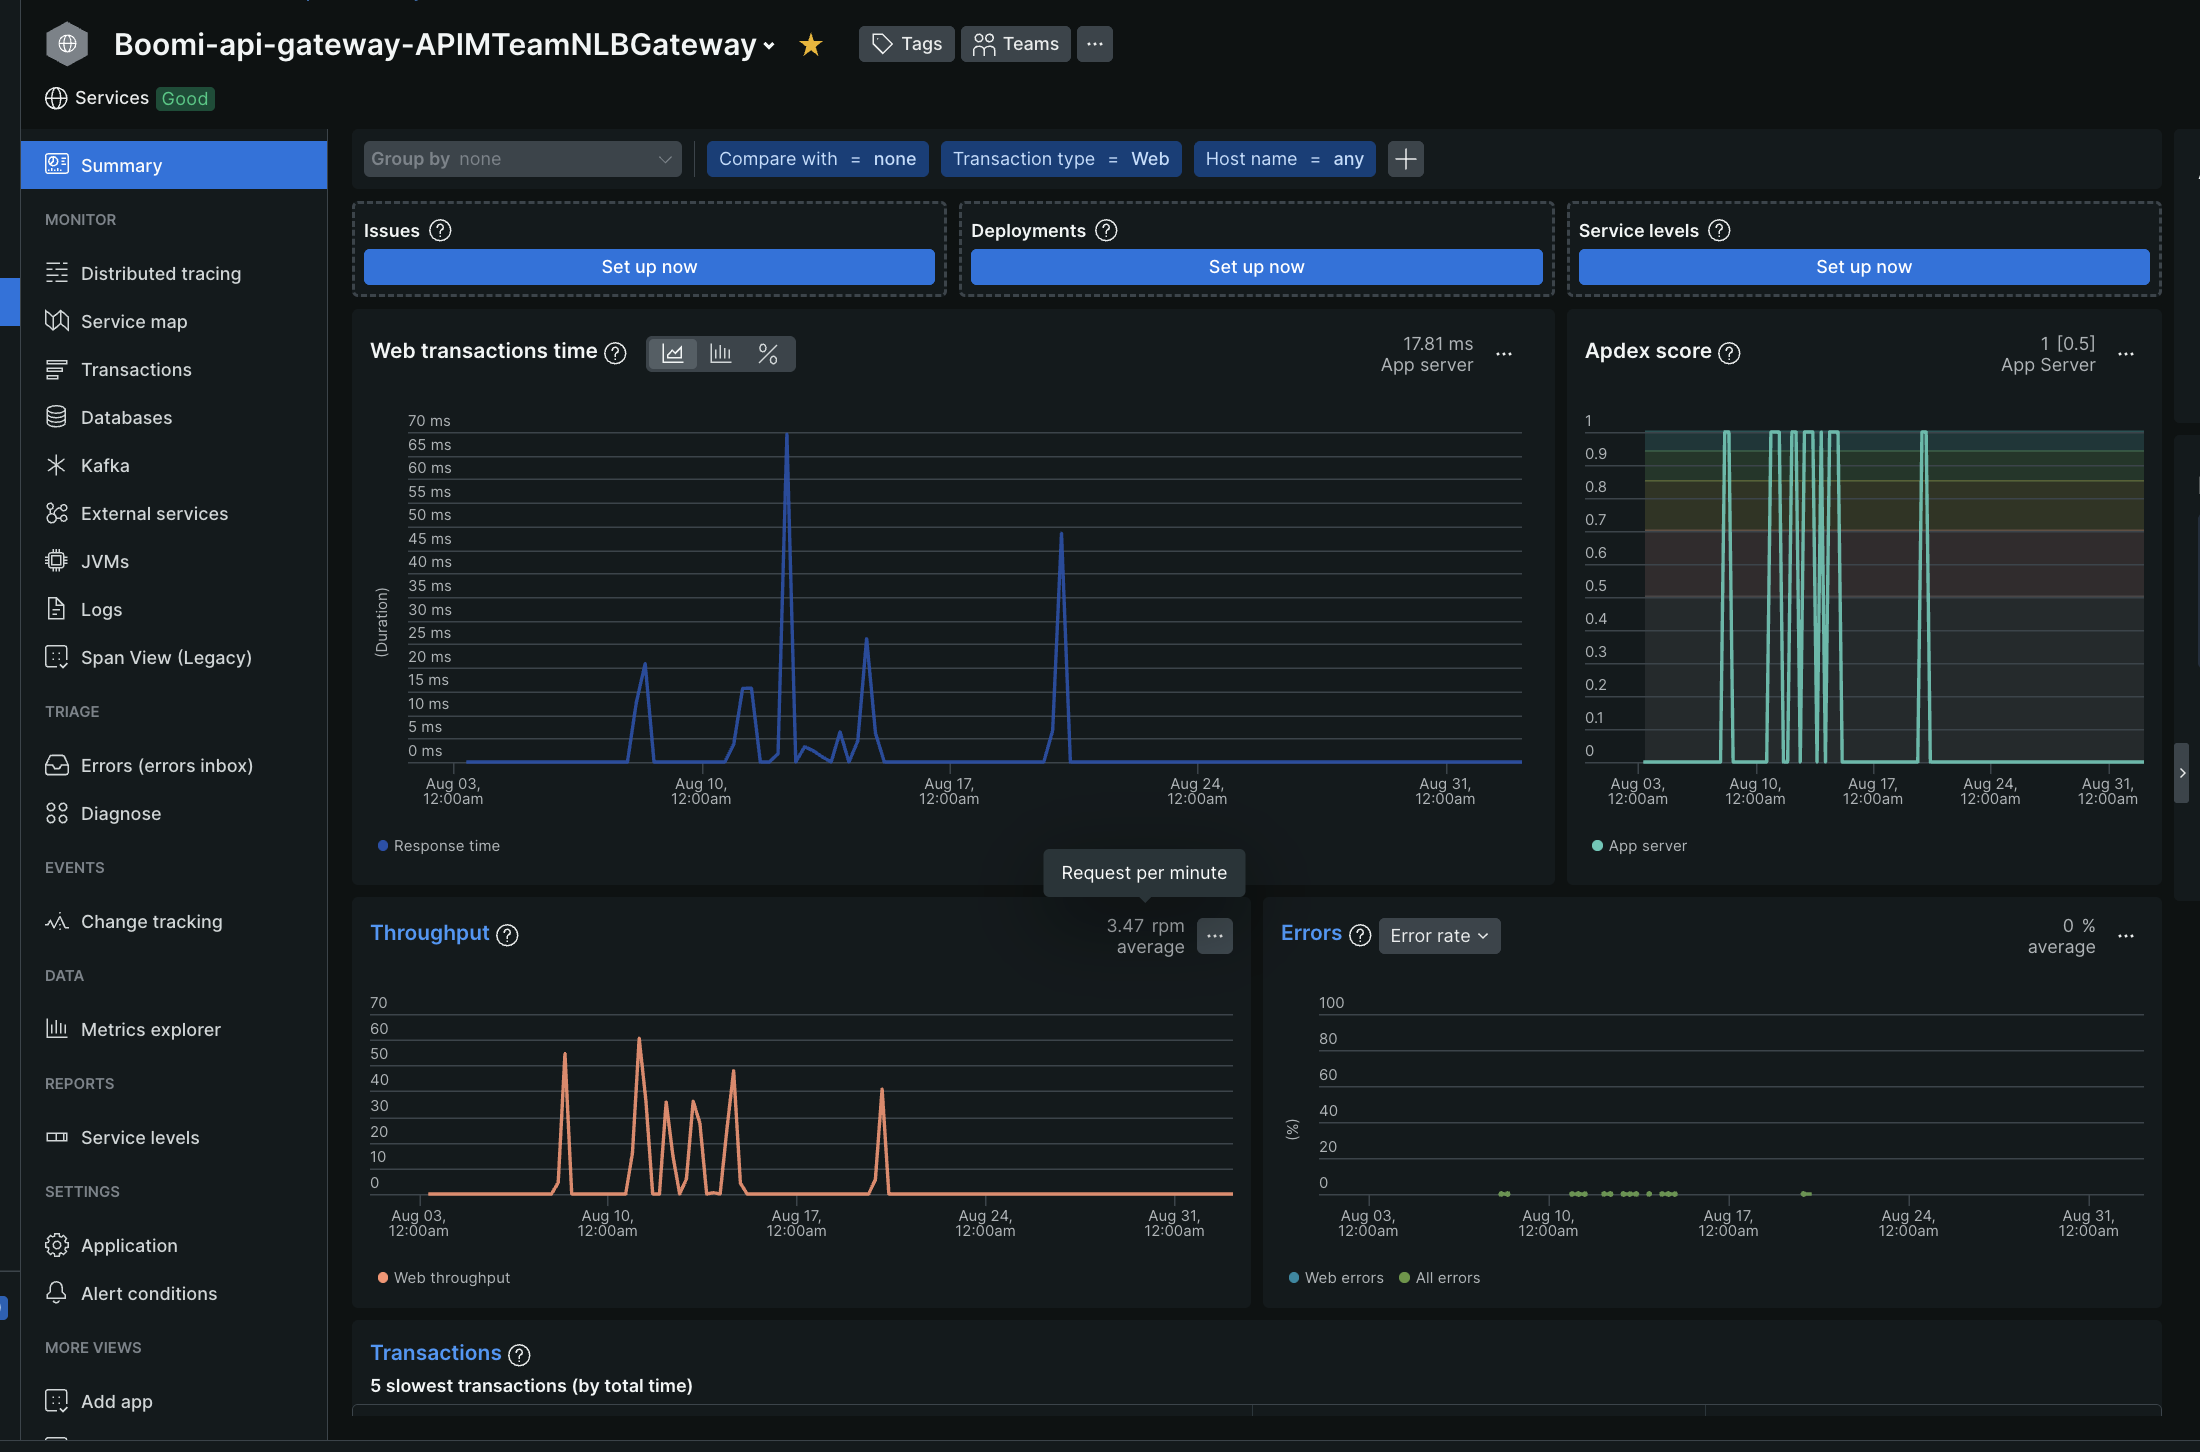
Visualization in Observability Tool
When the telemetry reaches the observability backend, it becomes available for visualization in dashboards and monitoring tools.
For traces, you can analyze request flows across services, identify latency, and locate bottlenecks or errors.
For logs, you can search and filter events that the Gateway generates and correlate them with trace IDs for efficient debugging.
For metrics, you can monitor key performance indicators such as response times, JVM memory usage, and CPU load while tracking long-term trends for capacity planning.
Attributes in Telemetry Data
Every telemetry record includes attributes that identify its source, ensuring proper grouping and filtering in observability dashboards.
| Attribute | Description | Format |
|---|---|---|
| service.instance.id | Identifies the Gateway node in the cloud using the format. | {containername-nodename} Example: APIMTeamALBGateway-atom02 |
| service.name | Specifies the Gateway container name in the format. | Boomi-api-gateway-{containername} Example: Boomi-api-gateway-APIMTeamALBGateway |
| host.name | Indicates the fully qualified hostname of the Gateway. | Example: atom02.apimteamalbgateway.awsuse1.boomi.com |
These attributes help determine which Gateway instance generated a trace, metric, or log.